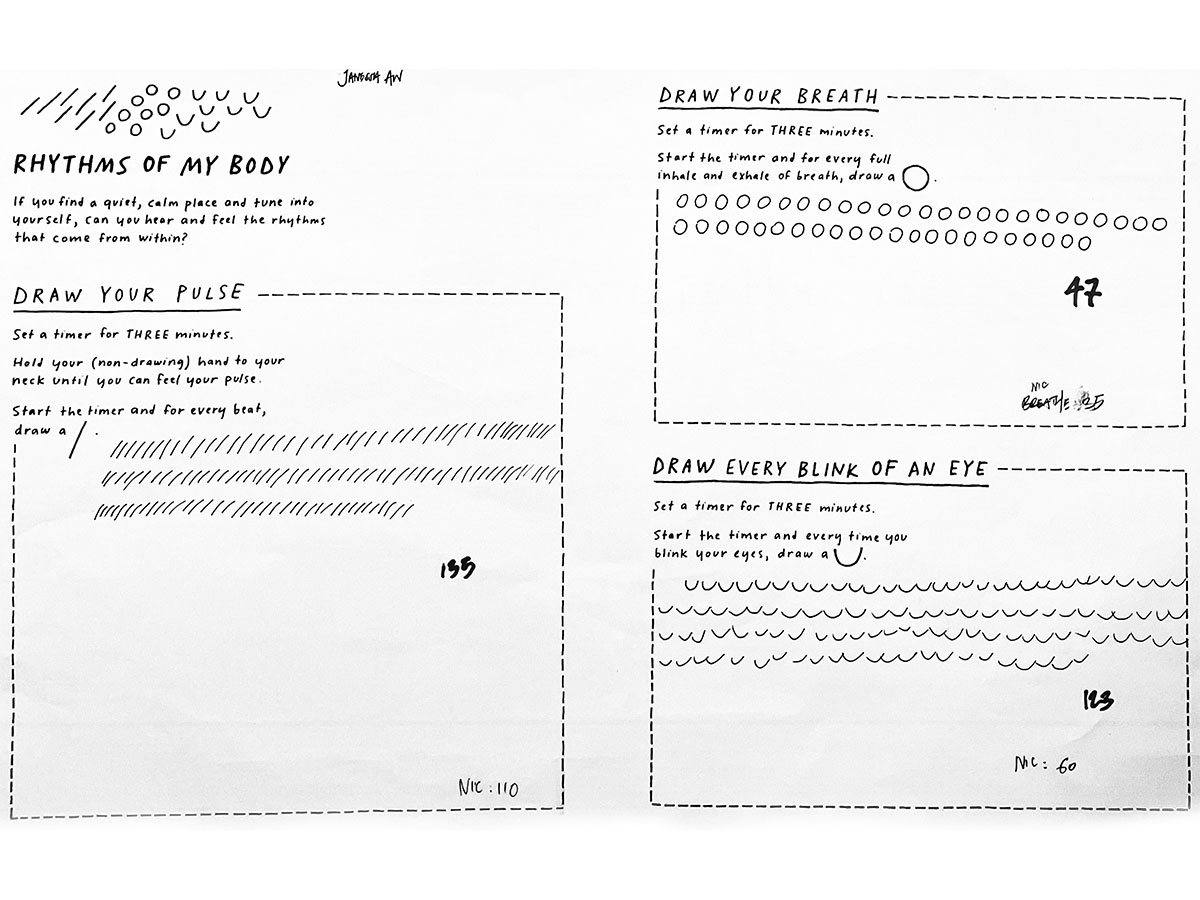
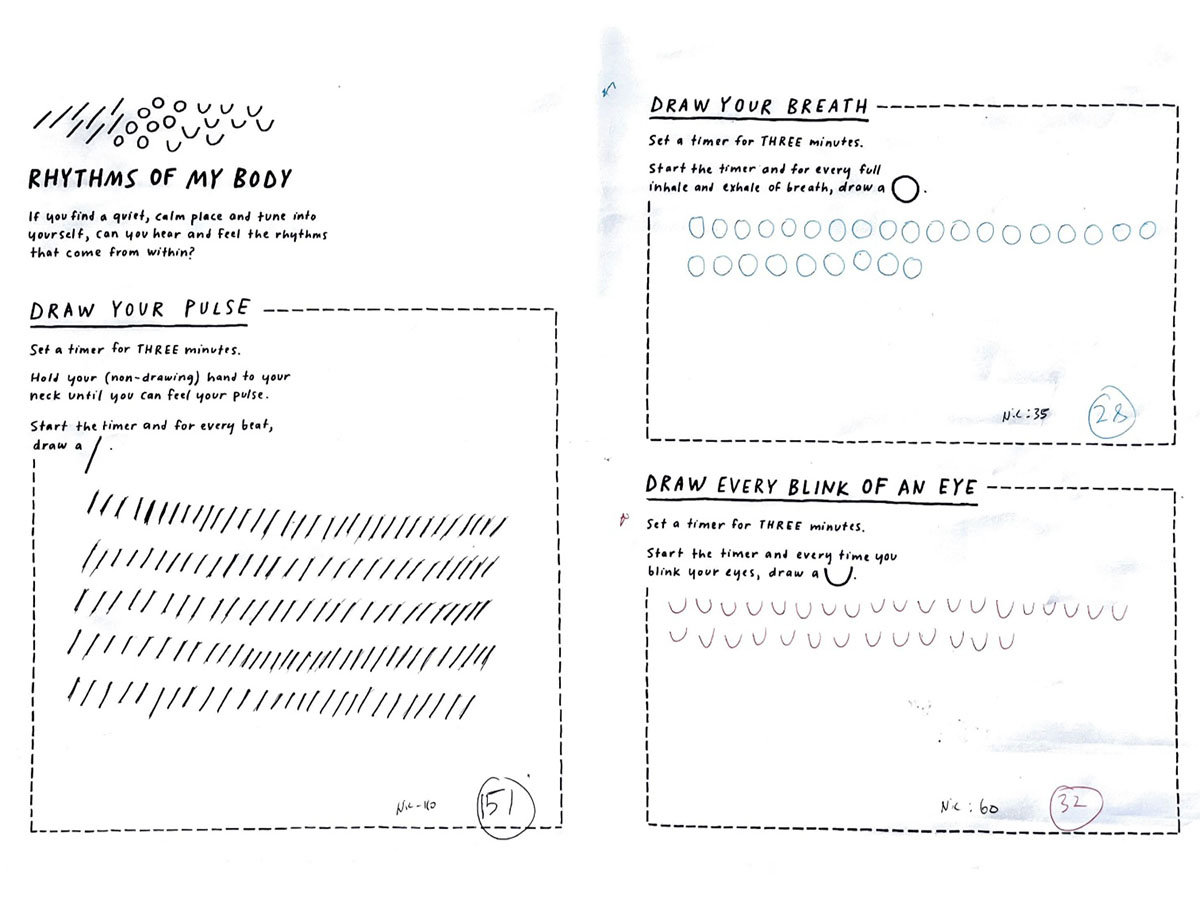
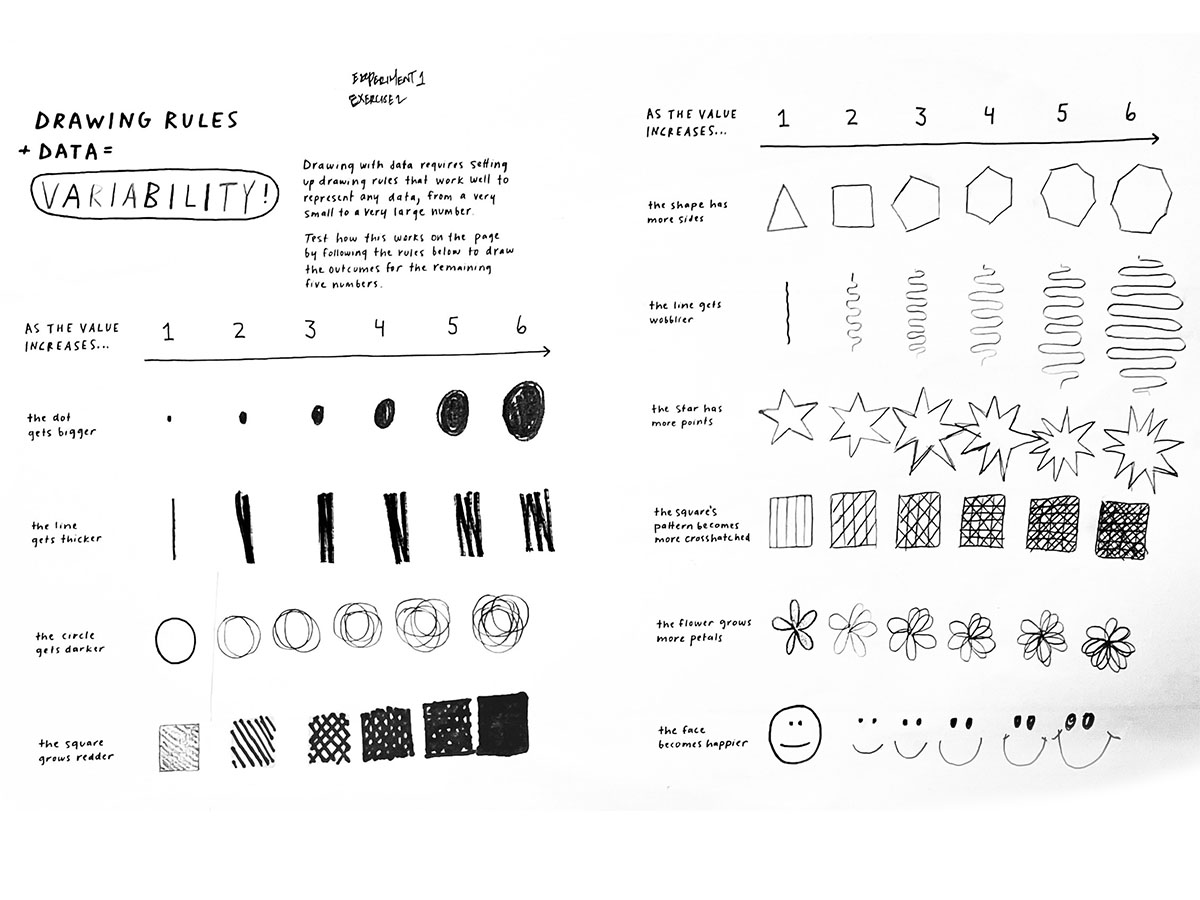
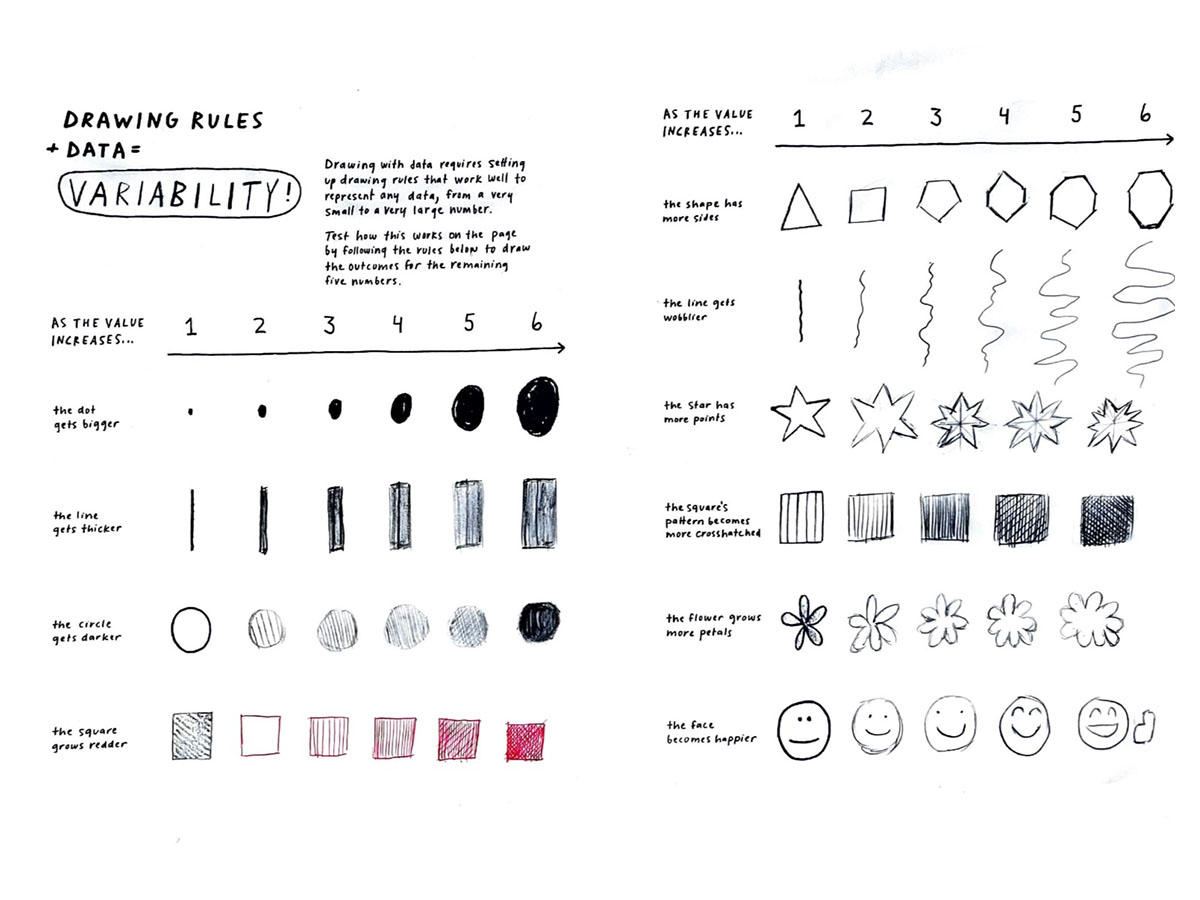
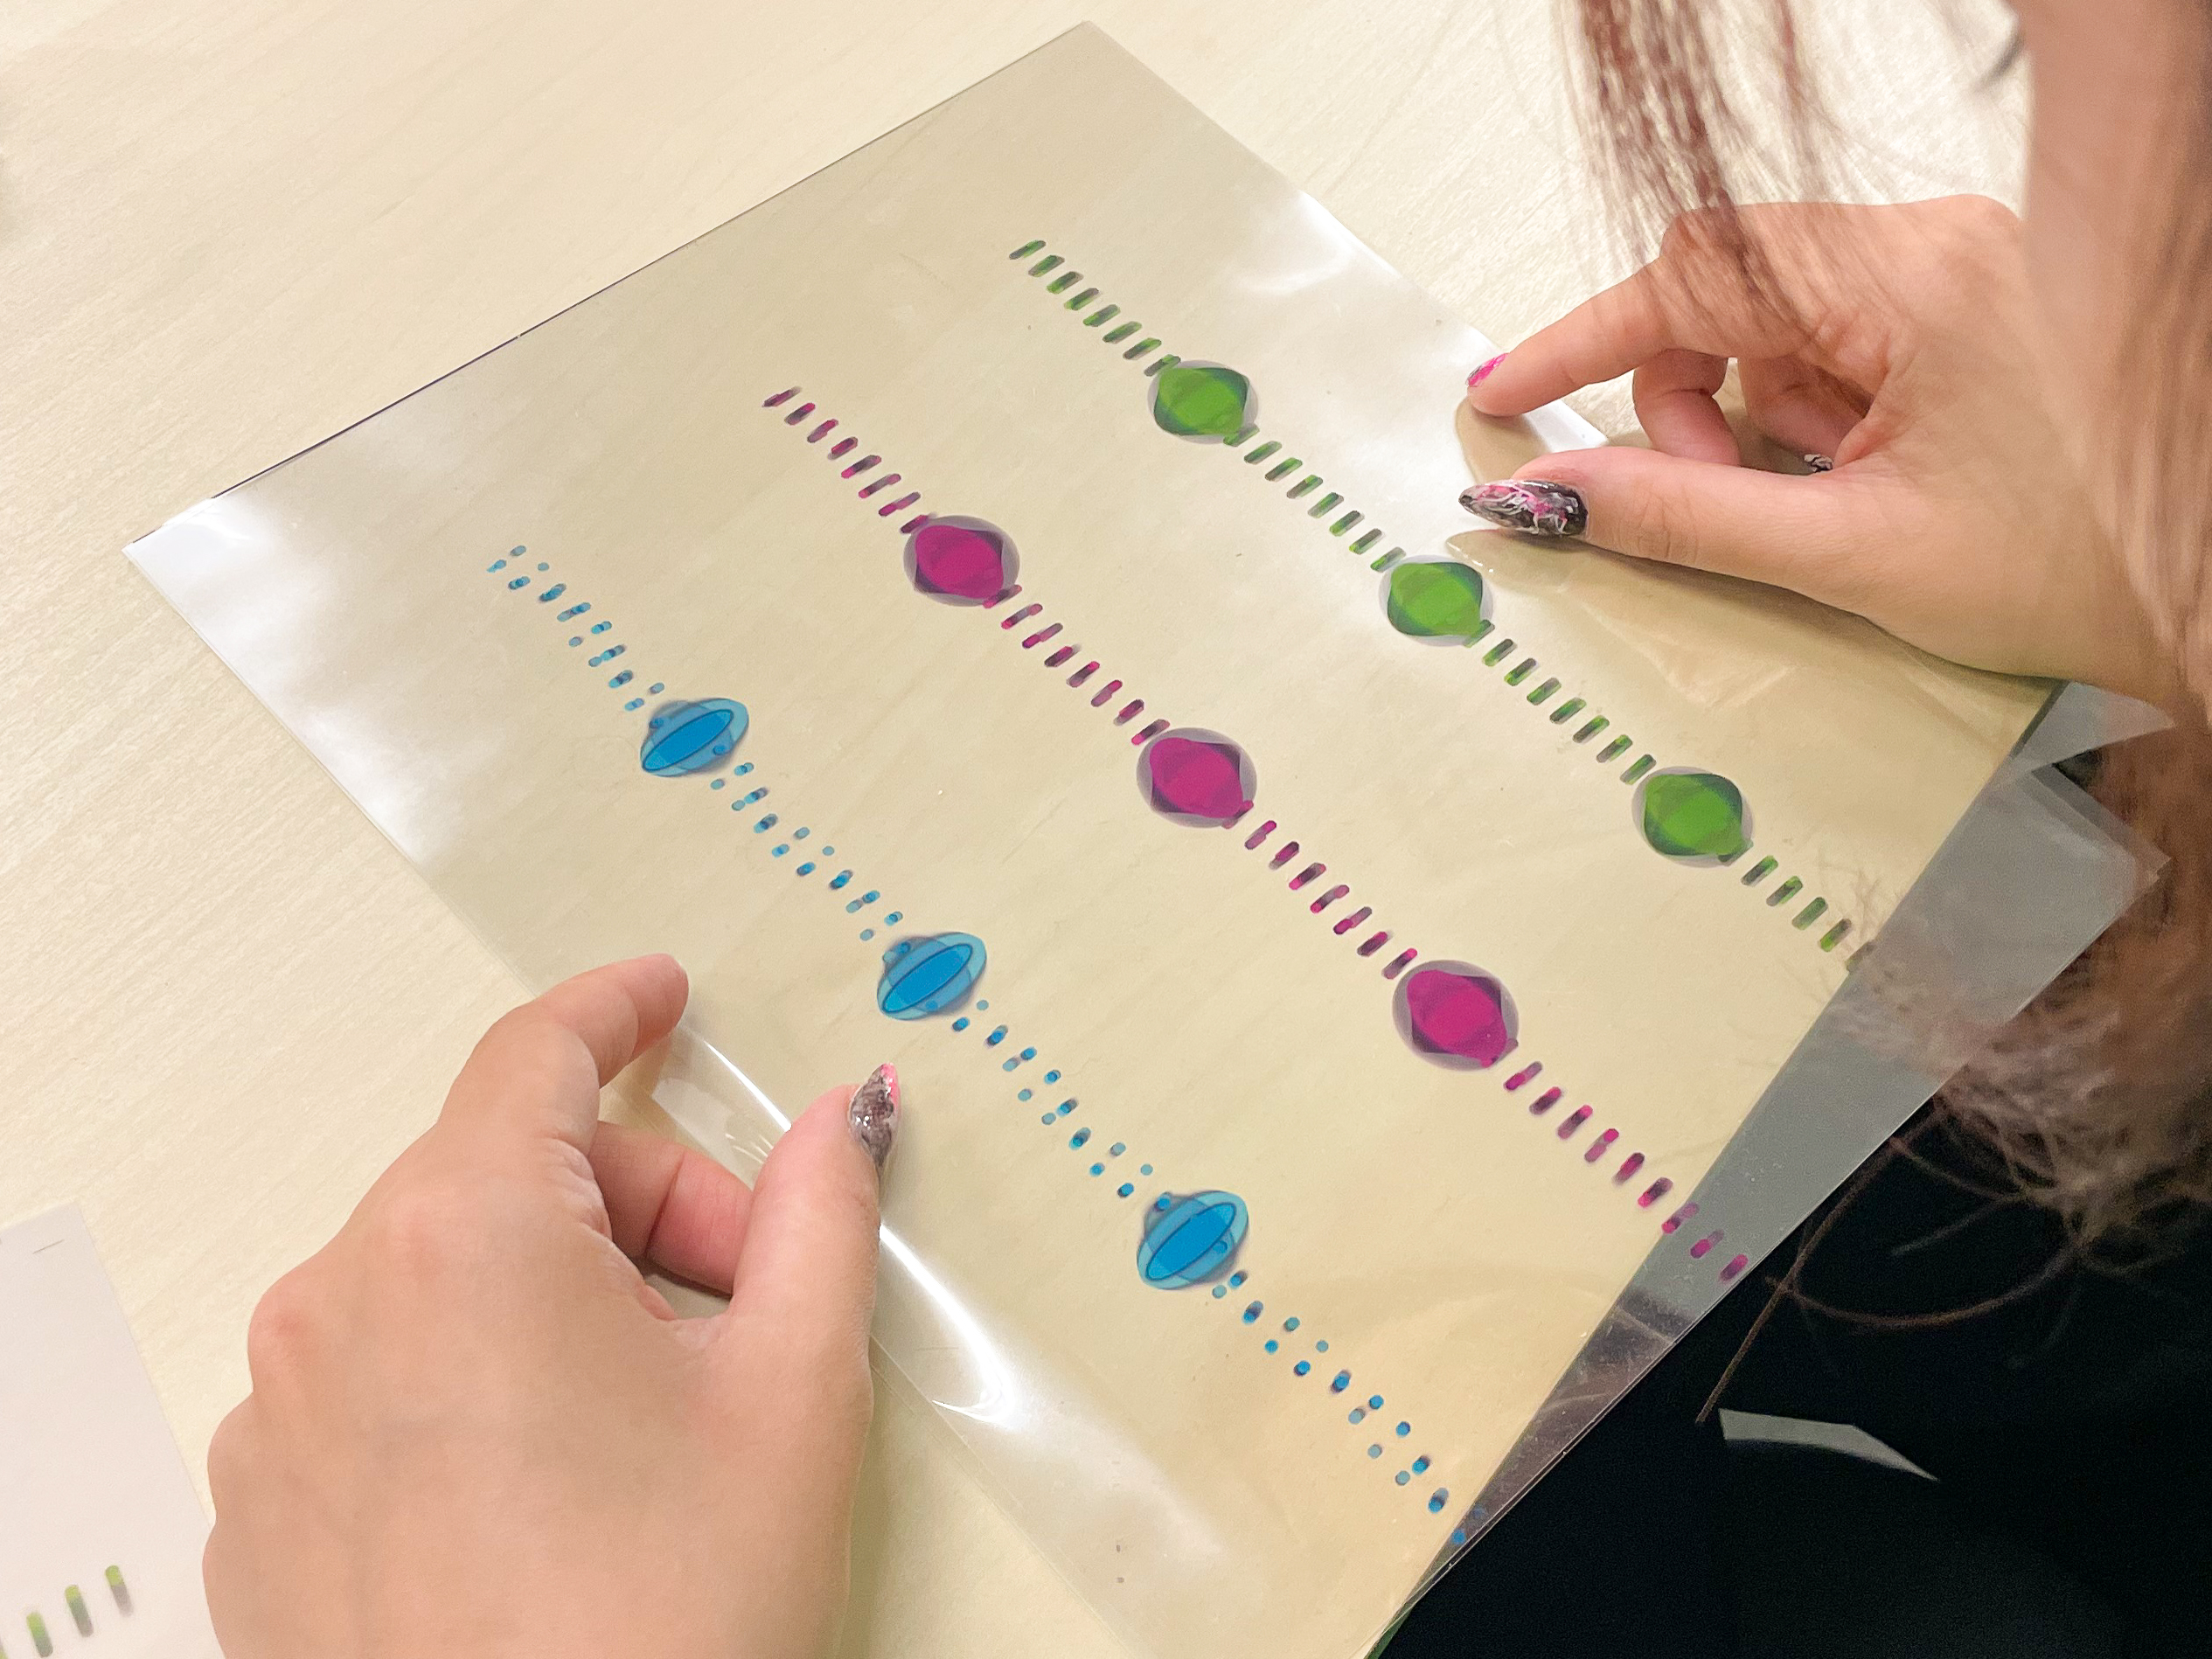
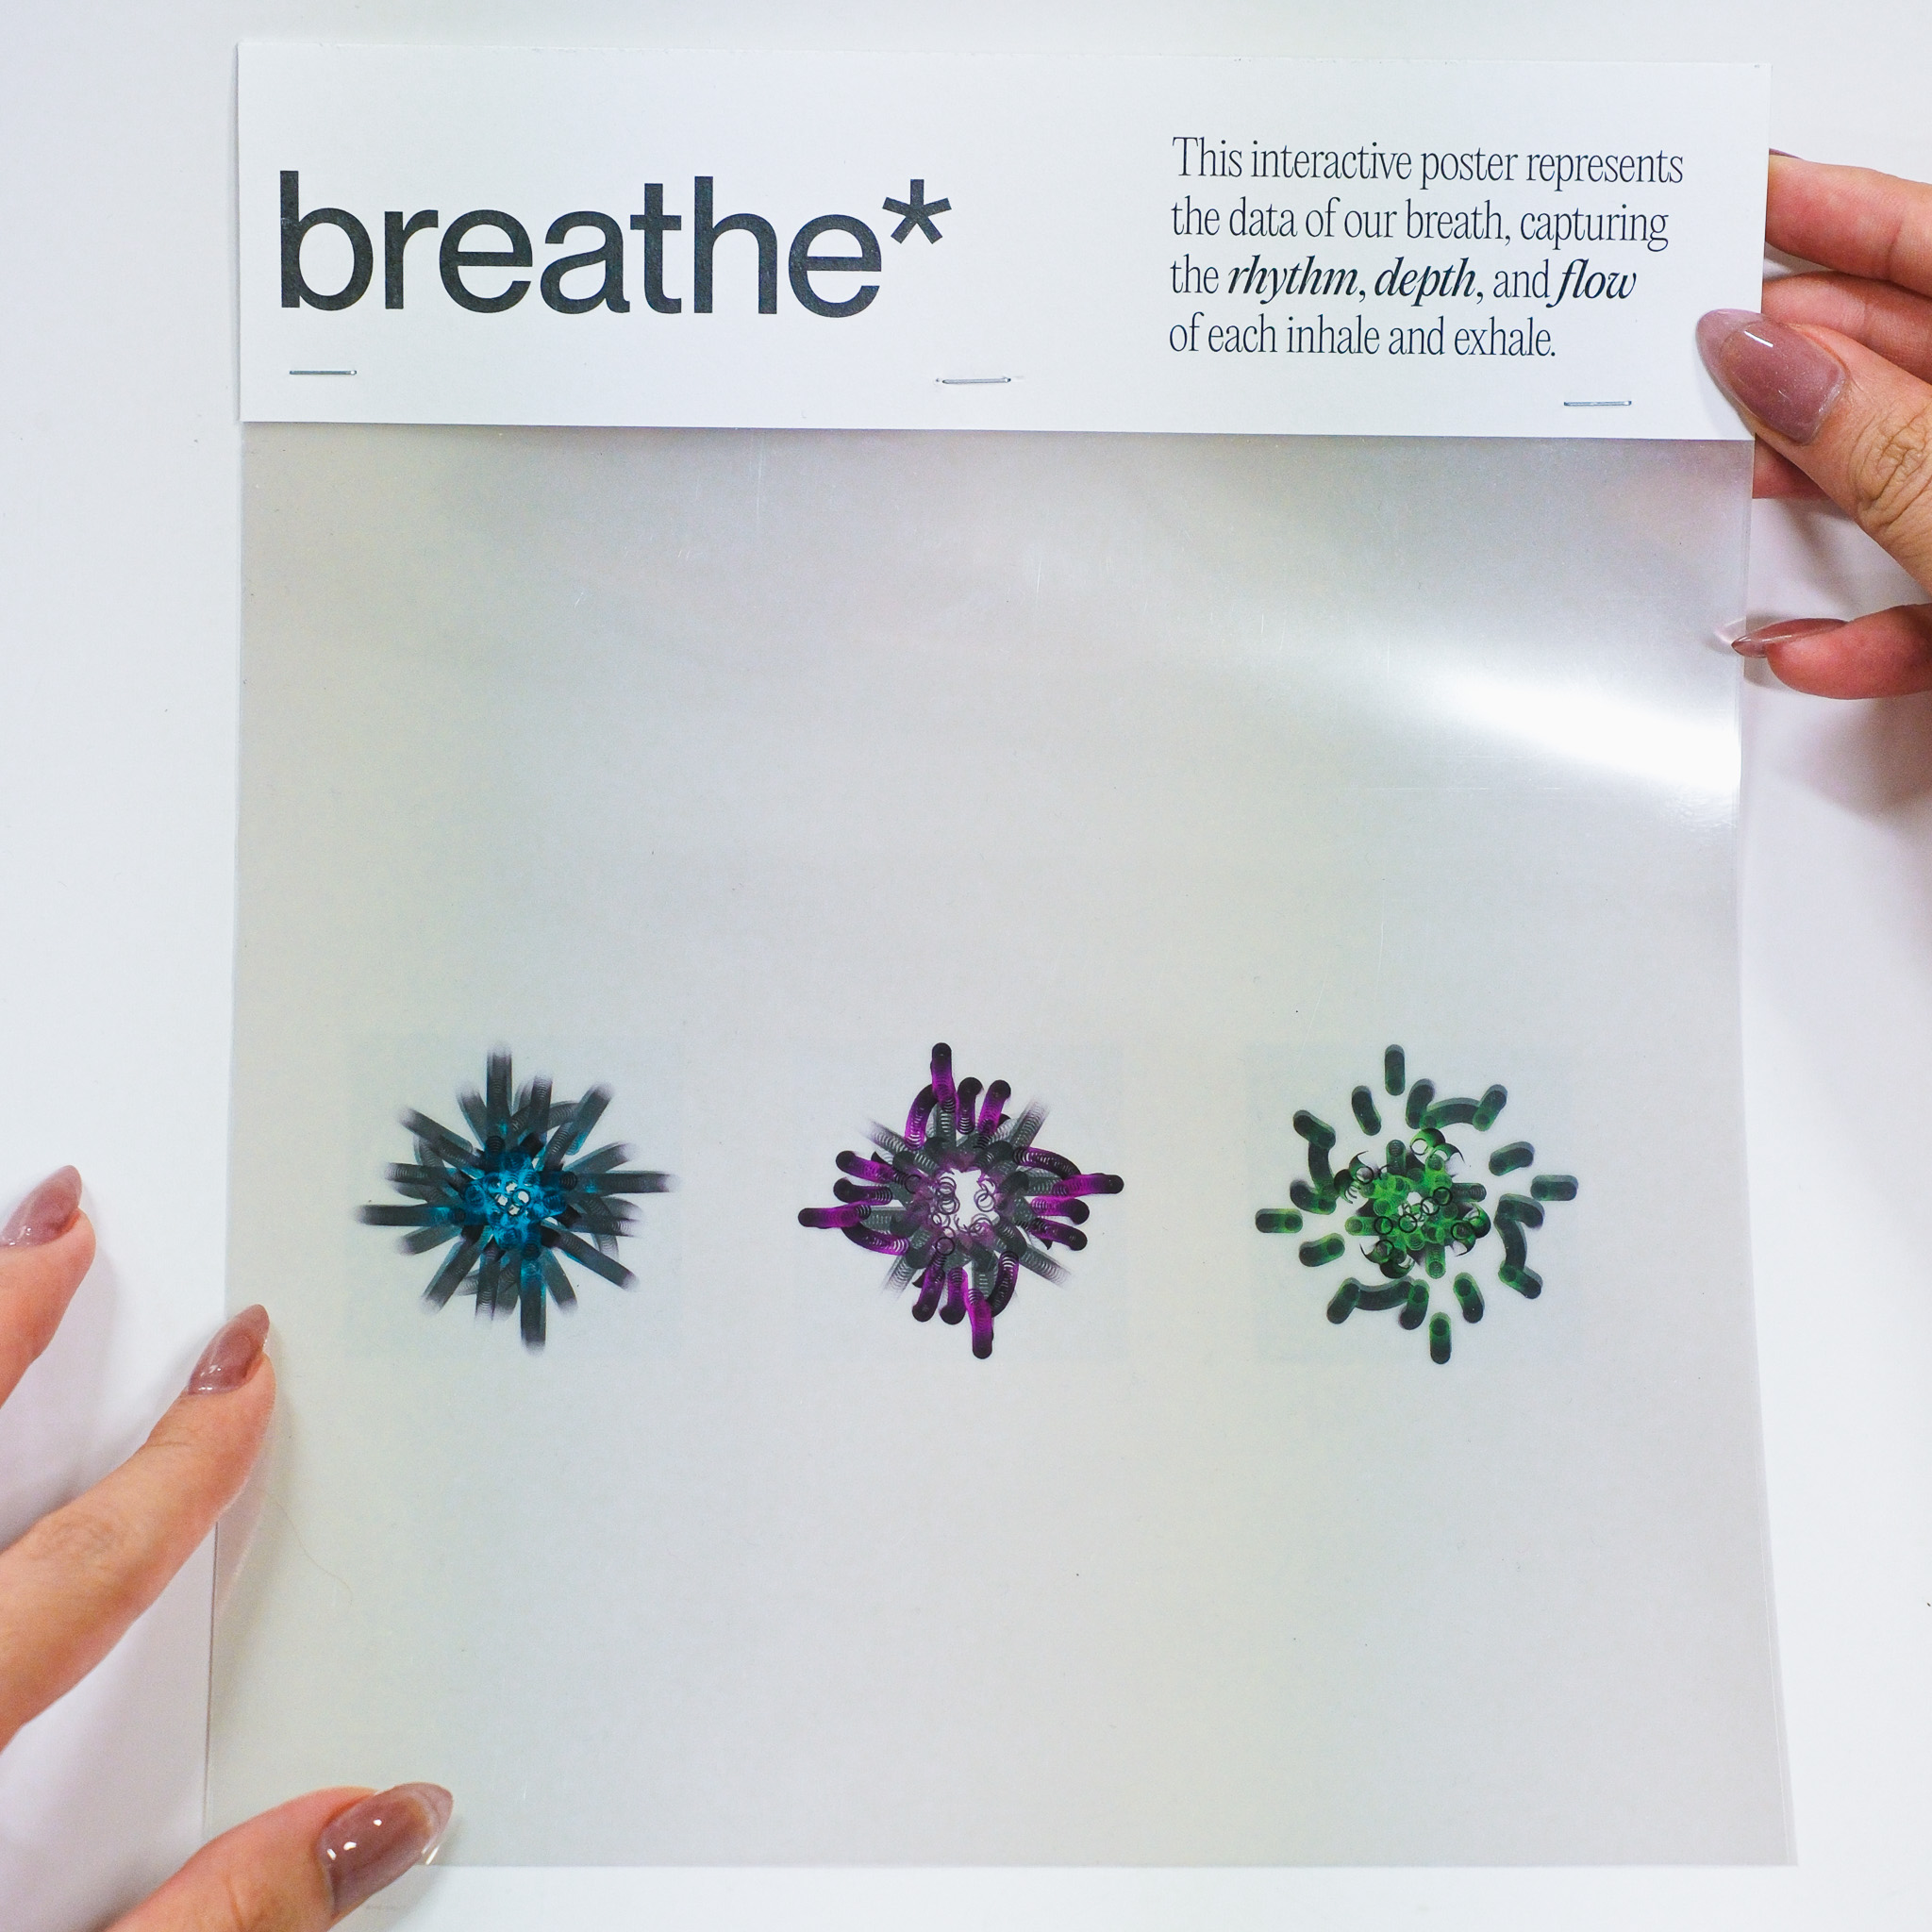
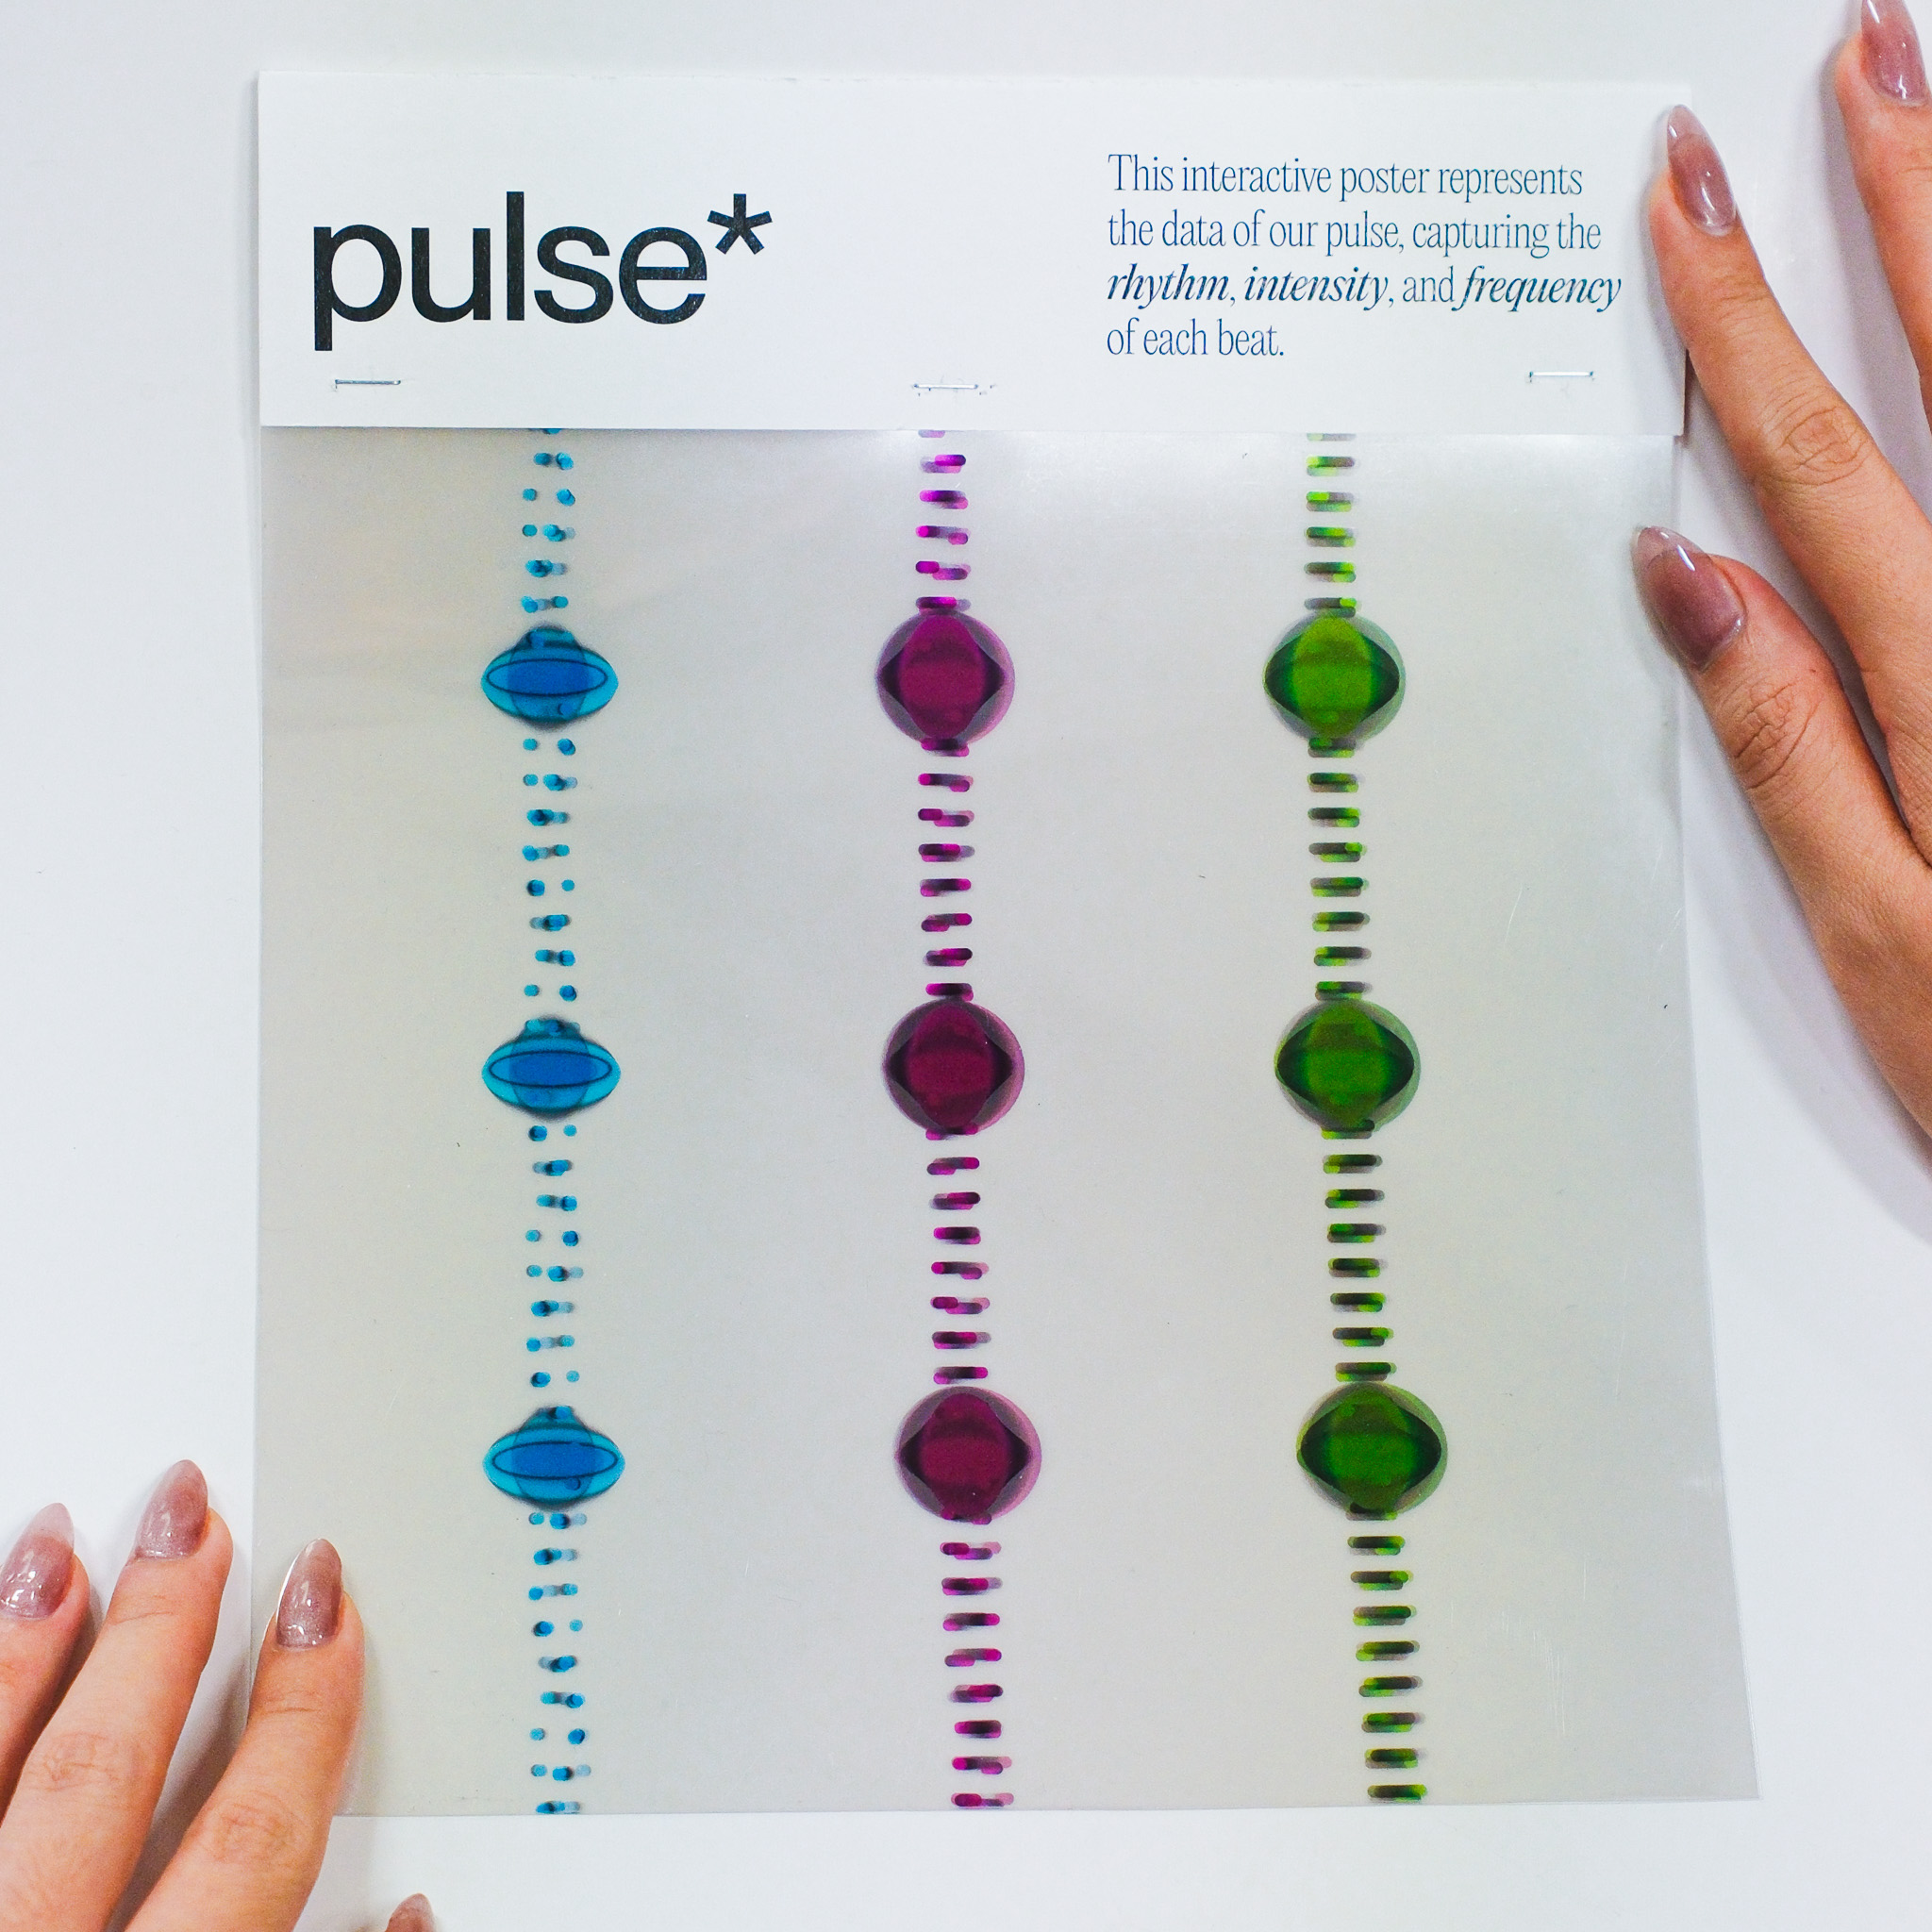
This experiment transforms three distinct data sets—blink, breath, and pulse—into dynamic visual expressions that capture the fluidity and variance in human rhythms. Through changes in speed, rhythm, frequency, intensity, and depth, the visuals illustrate the subtle yet constant fluctuations in our physiological states. In the accompanying series of interactive posters, each element—breath, blink, pulse—is explored individually, offering a unique visual narrative that highlights the difference of each data.
-
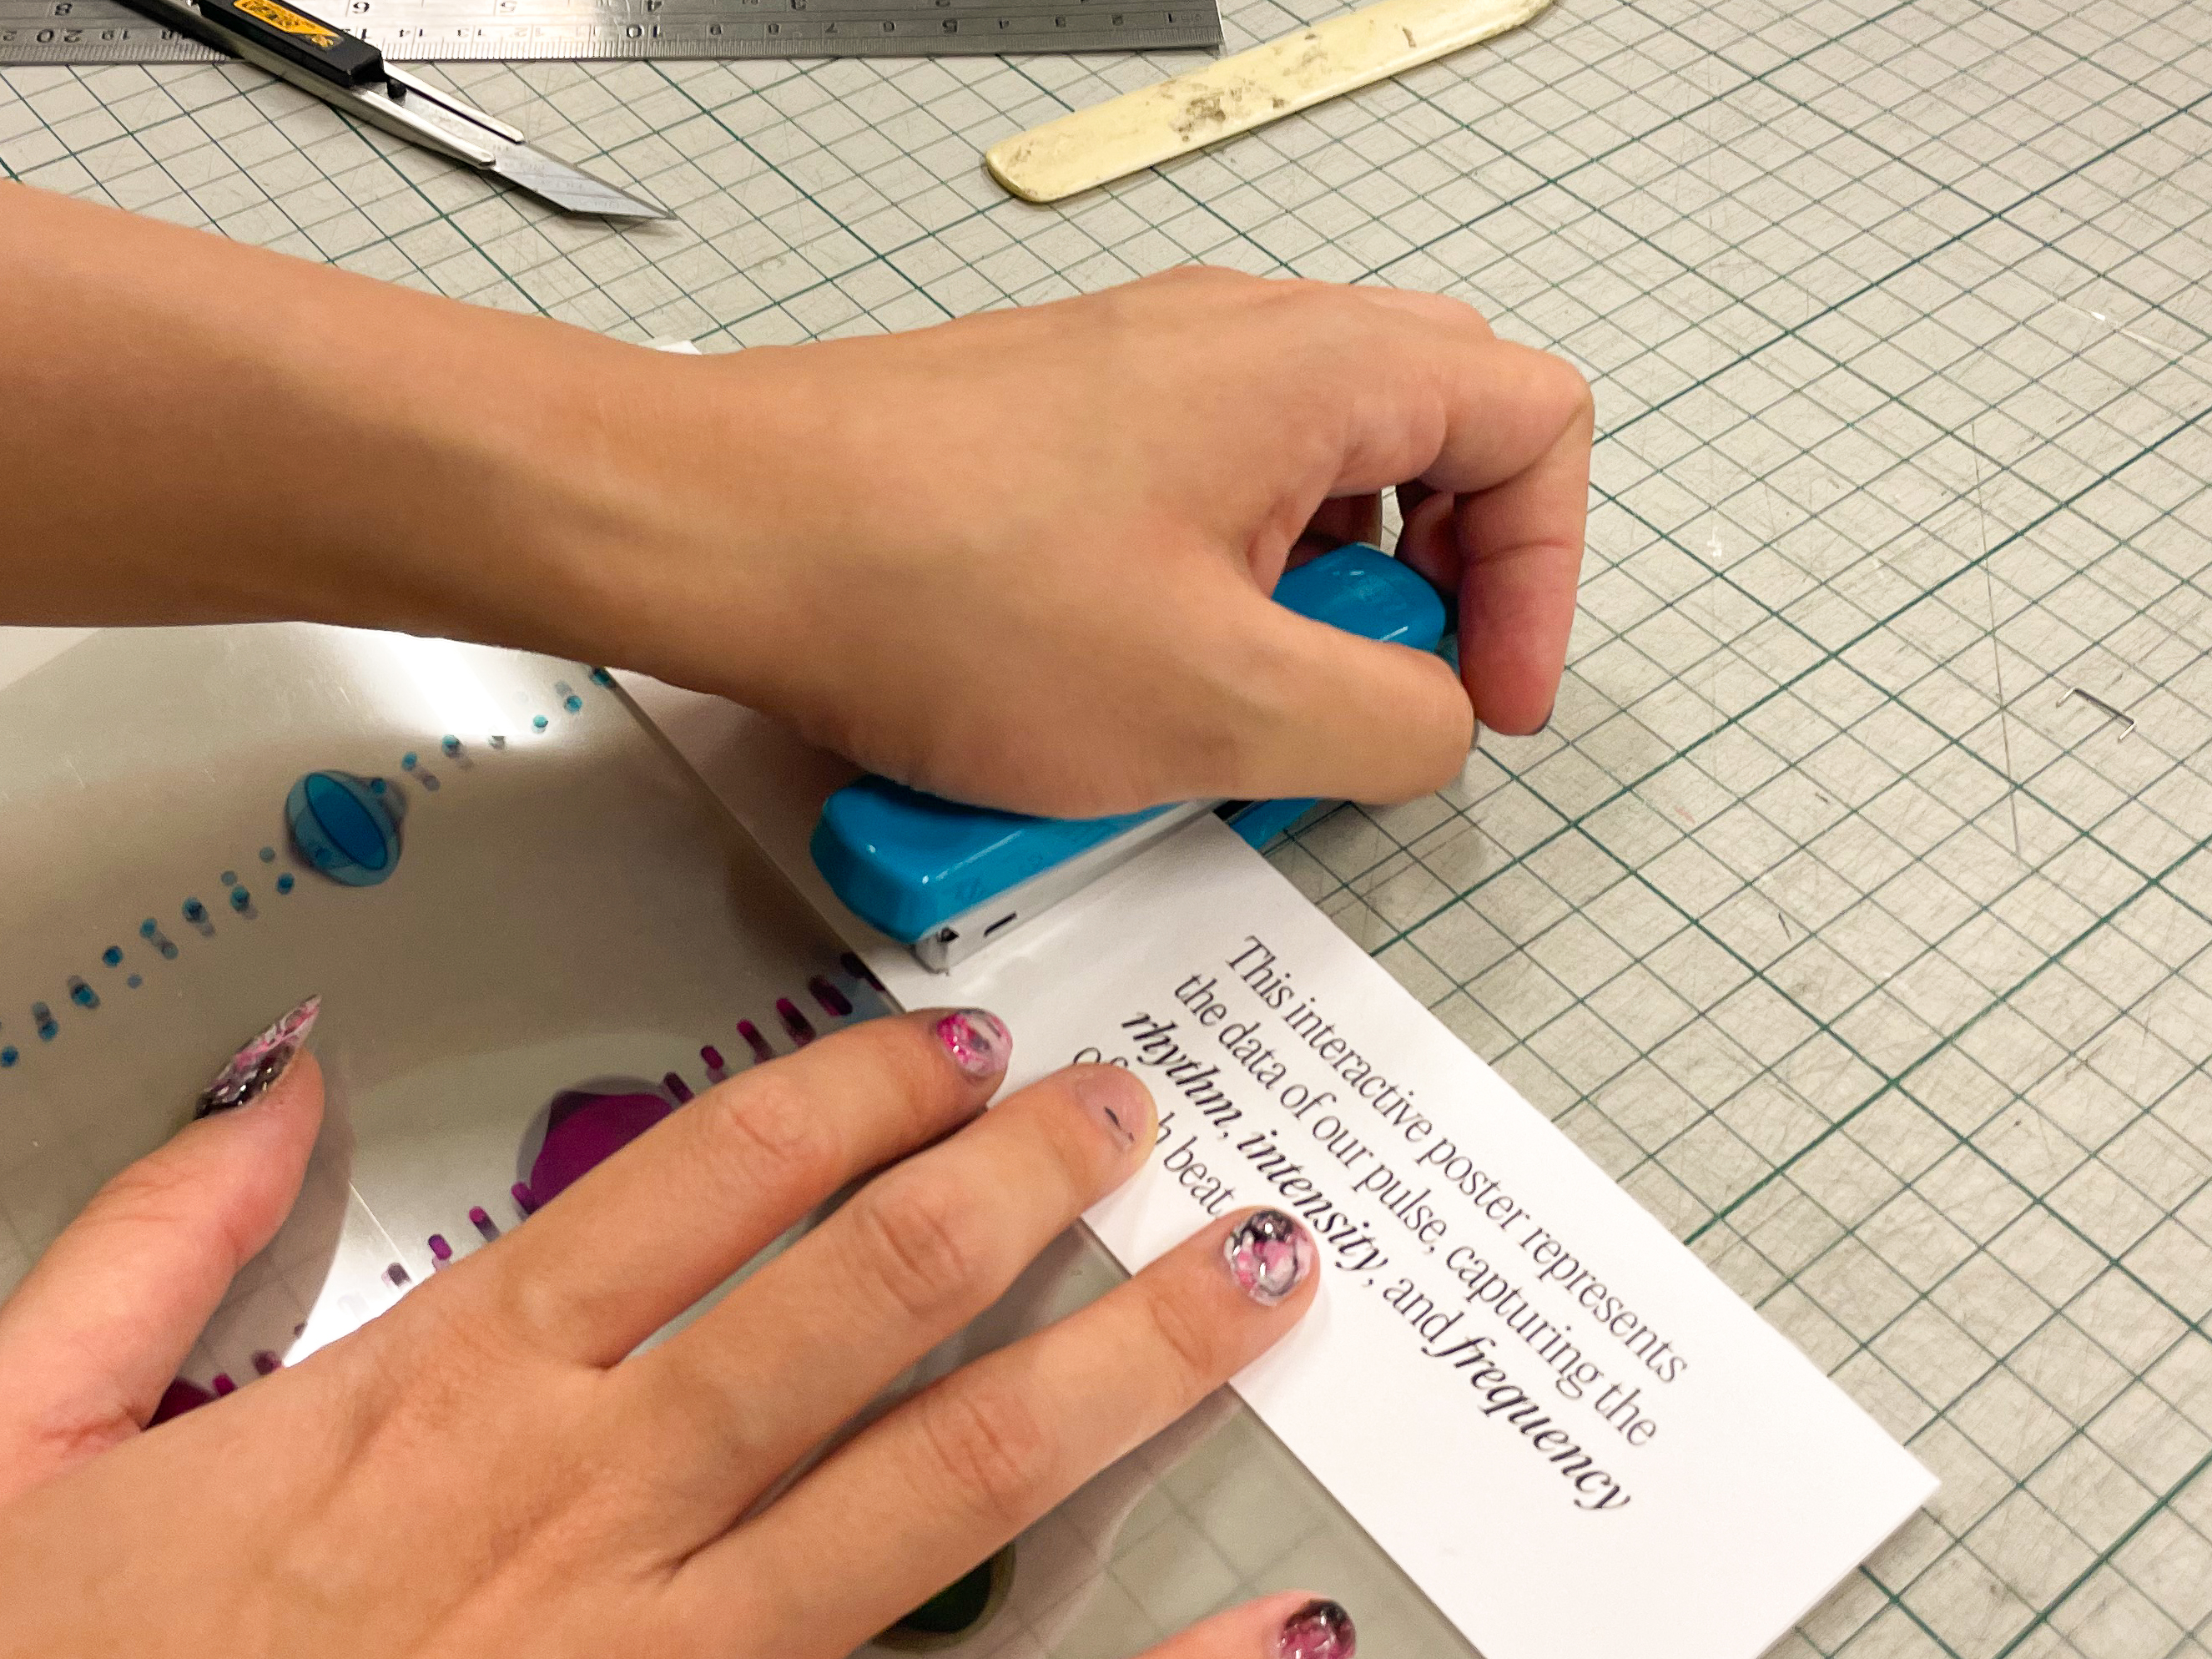
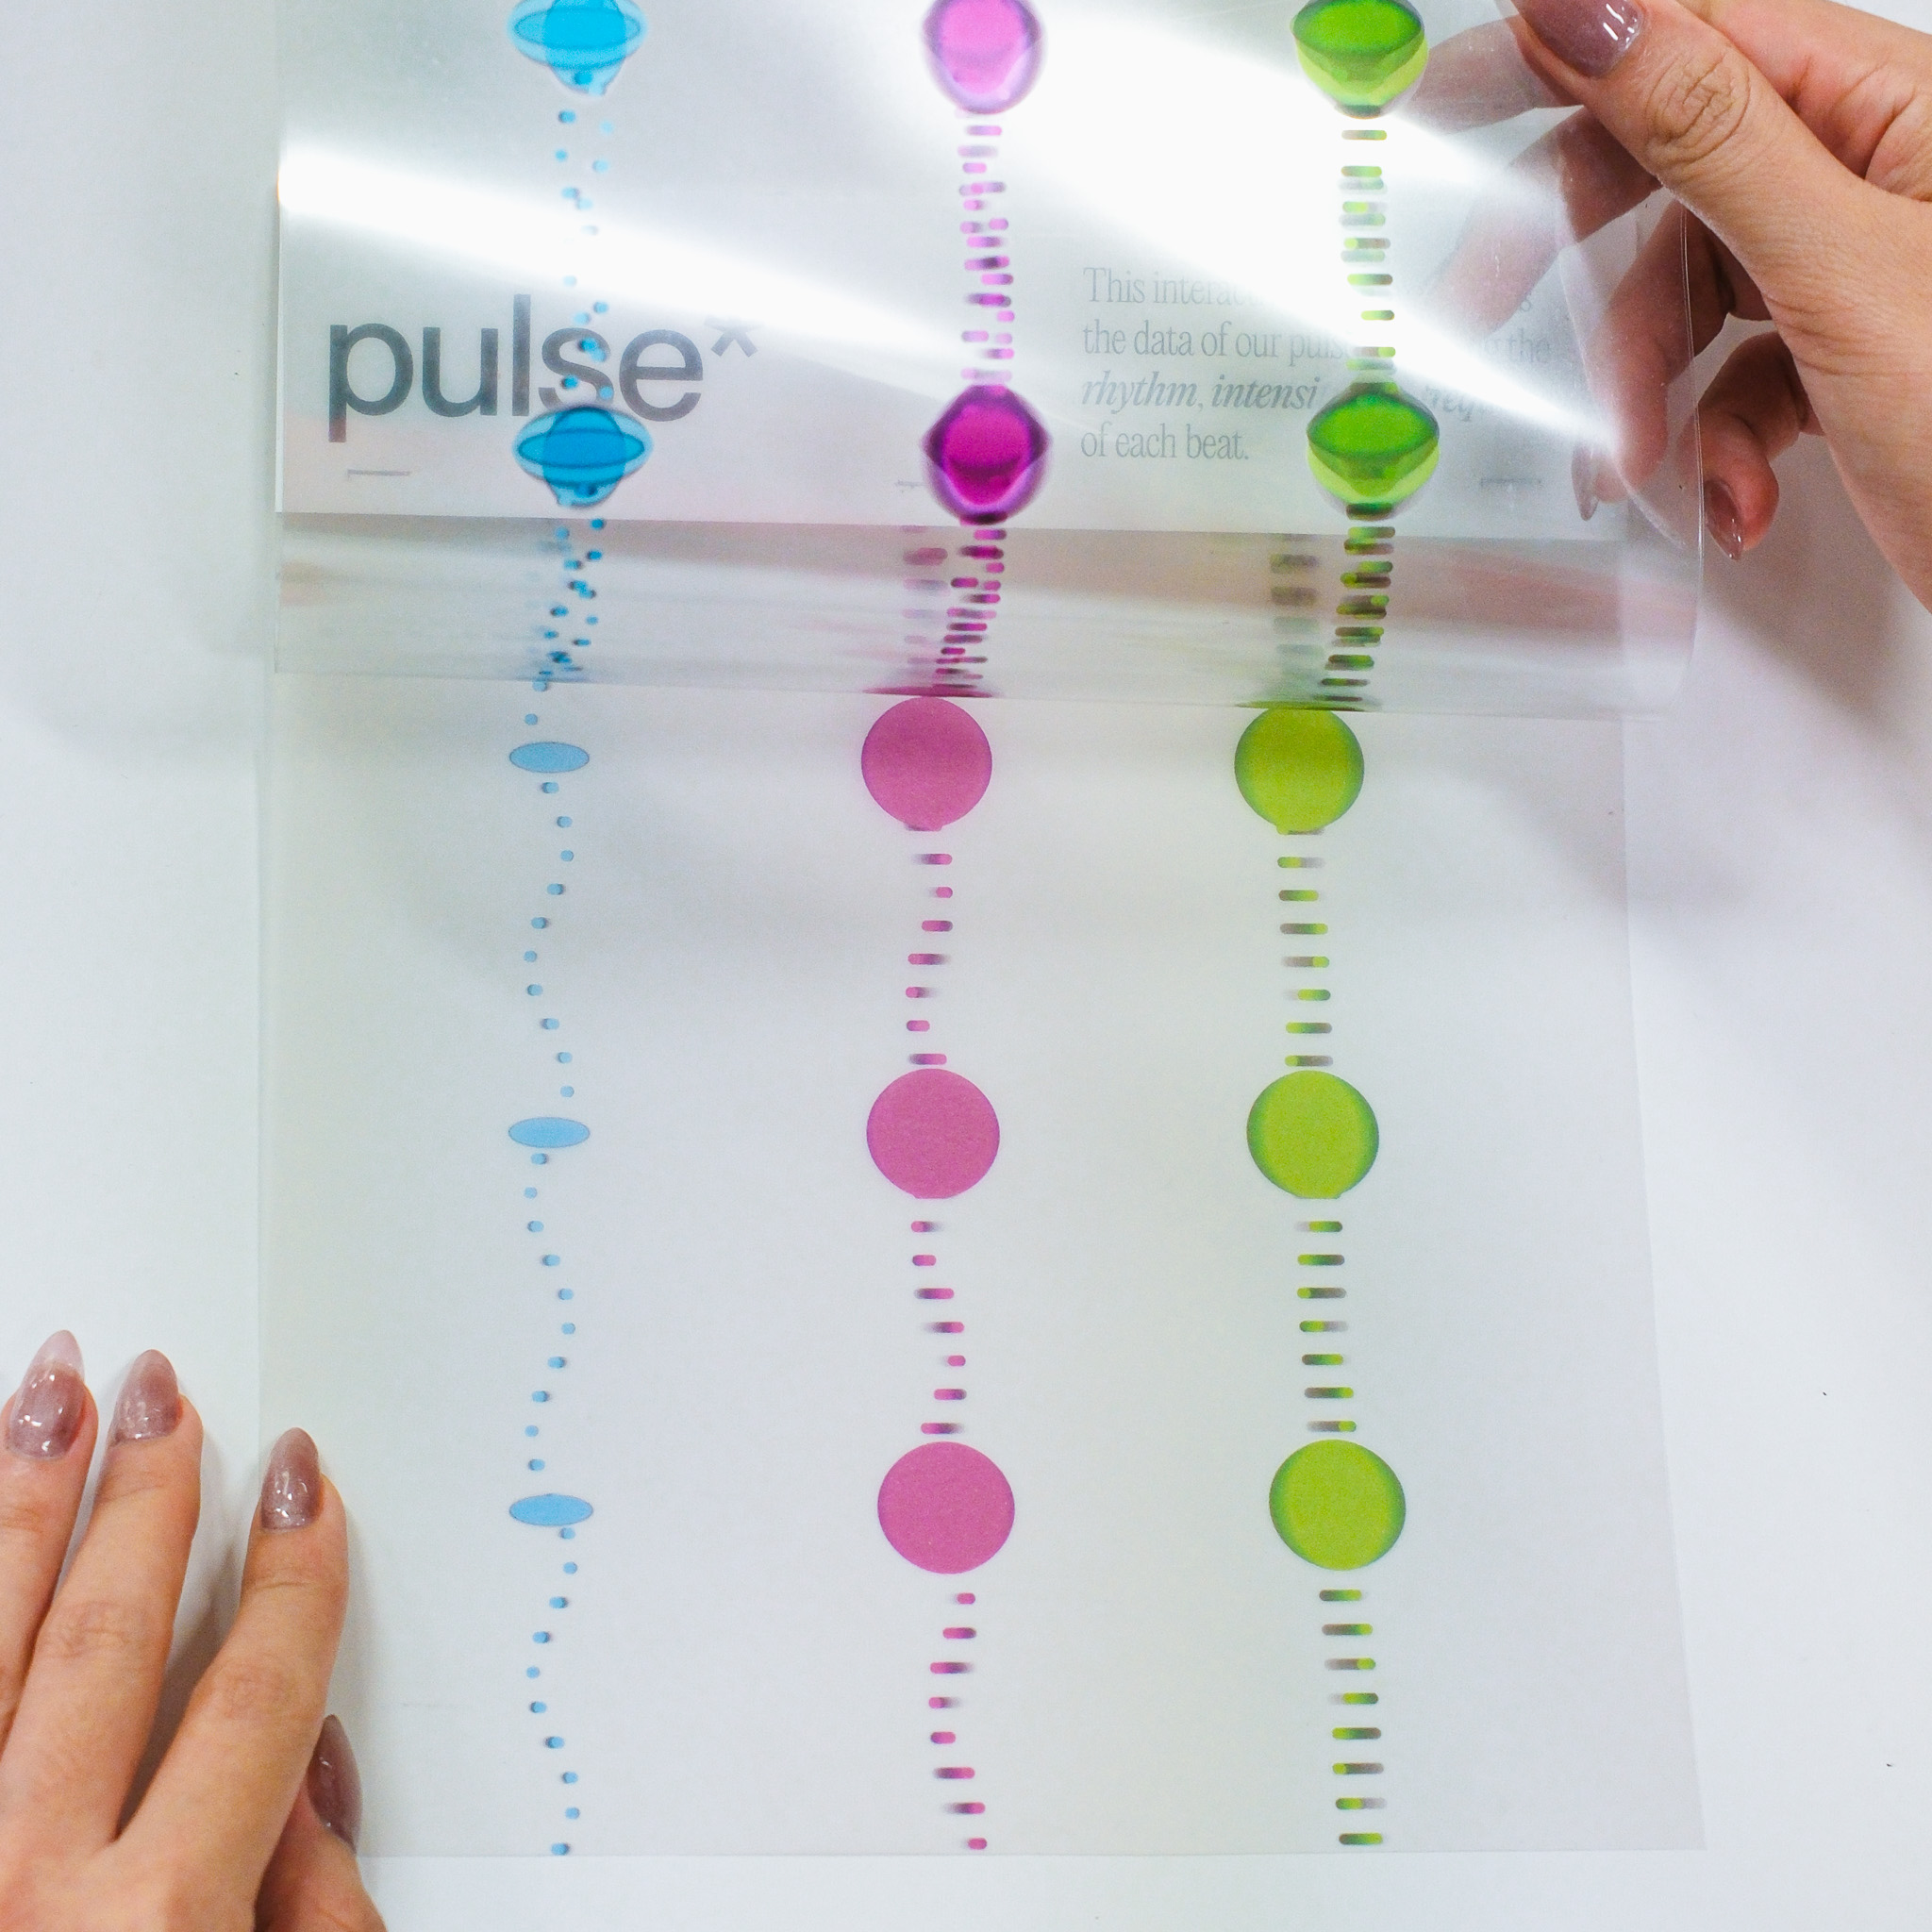
Stapling them together
-
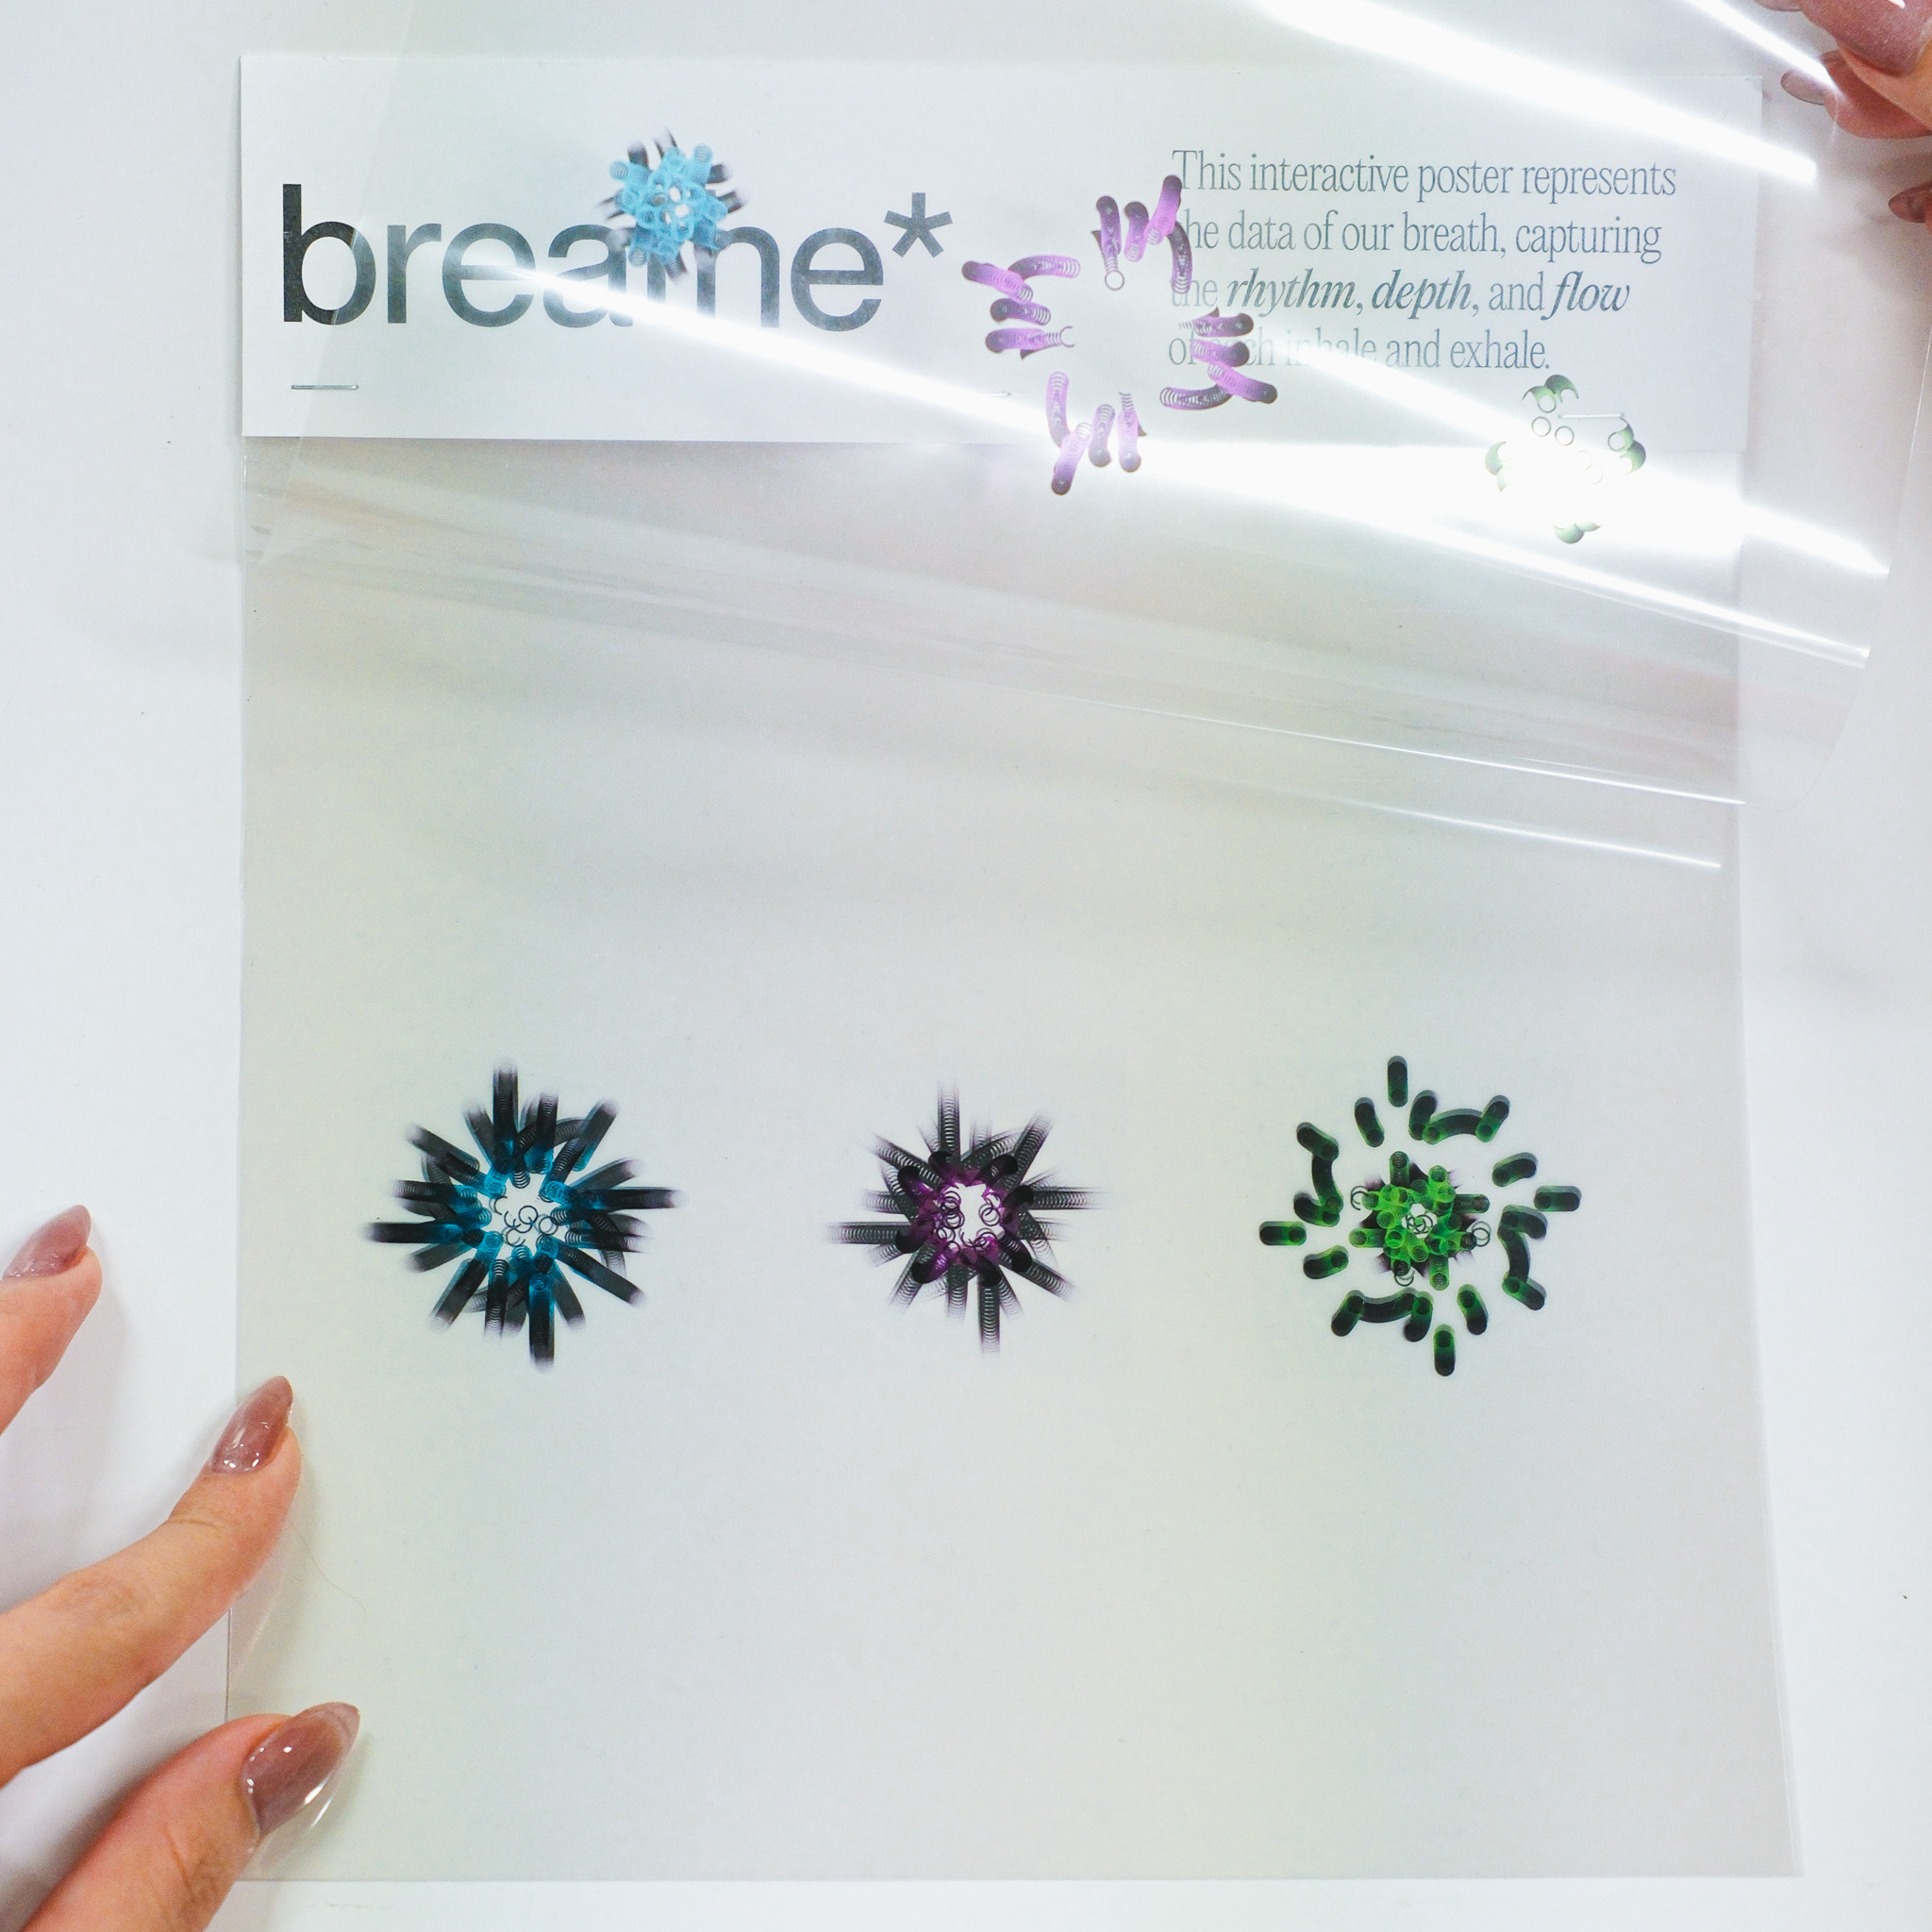
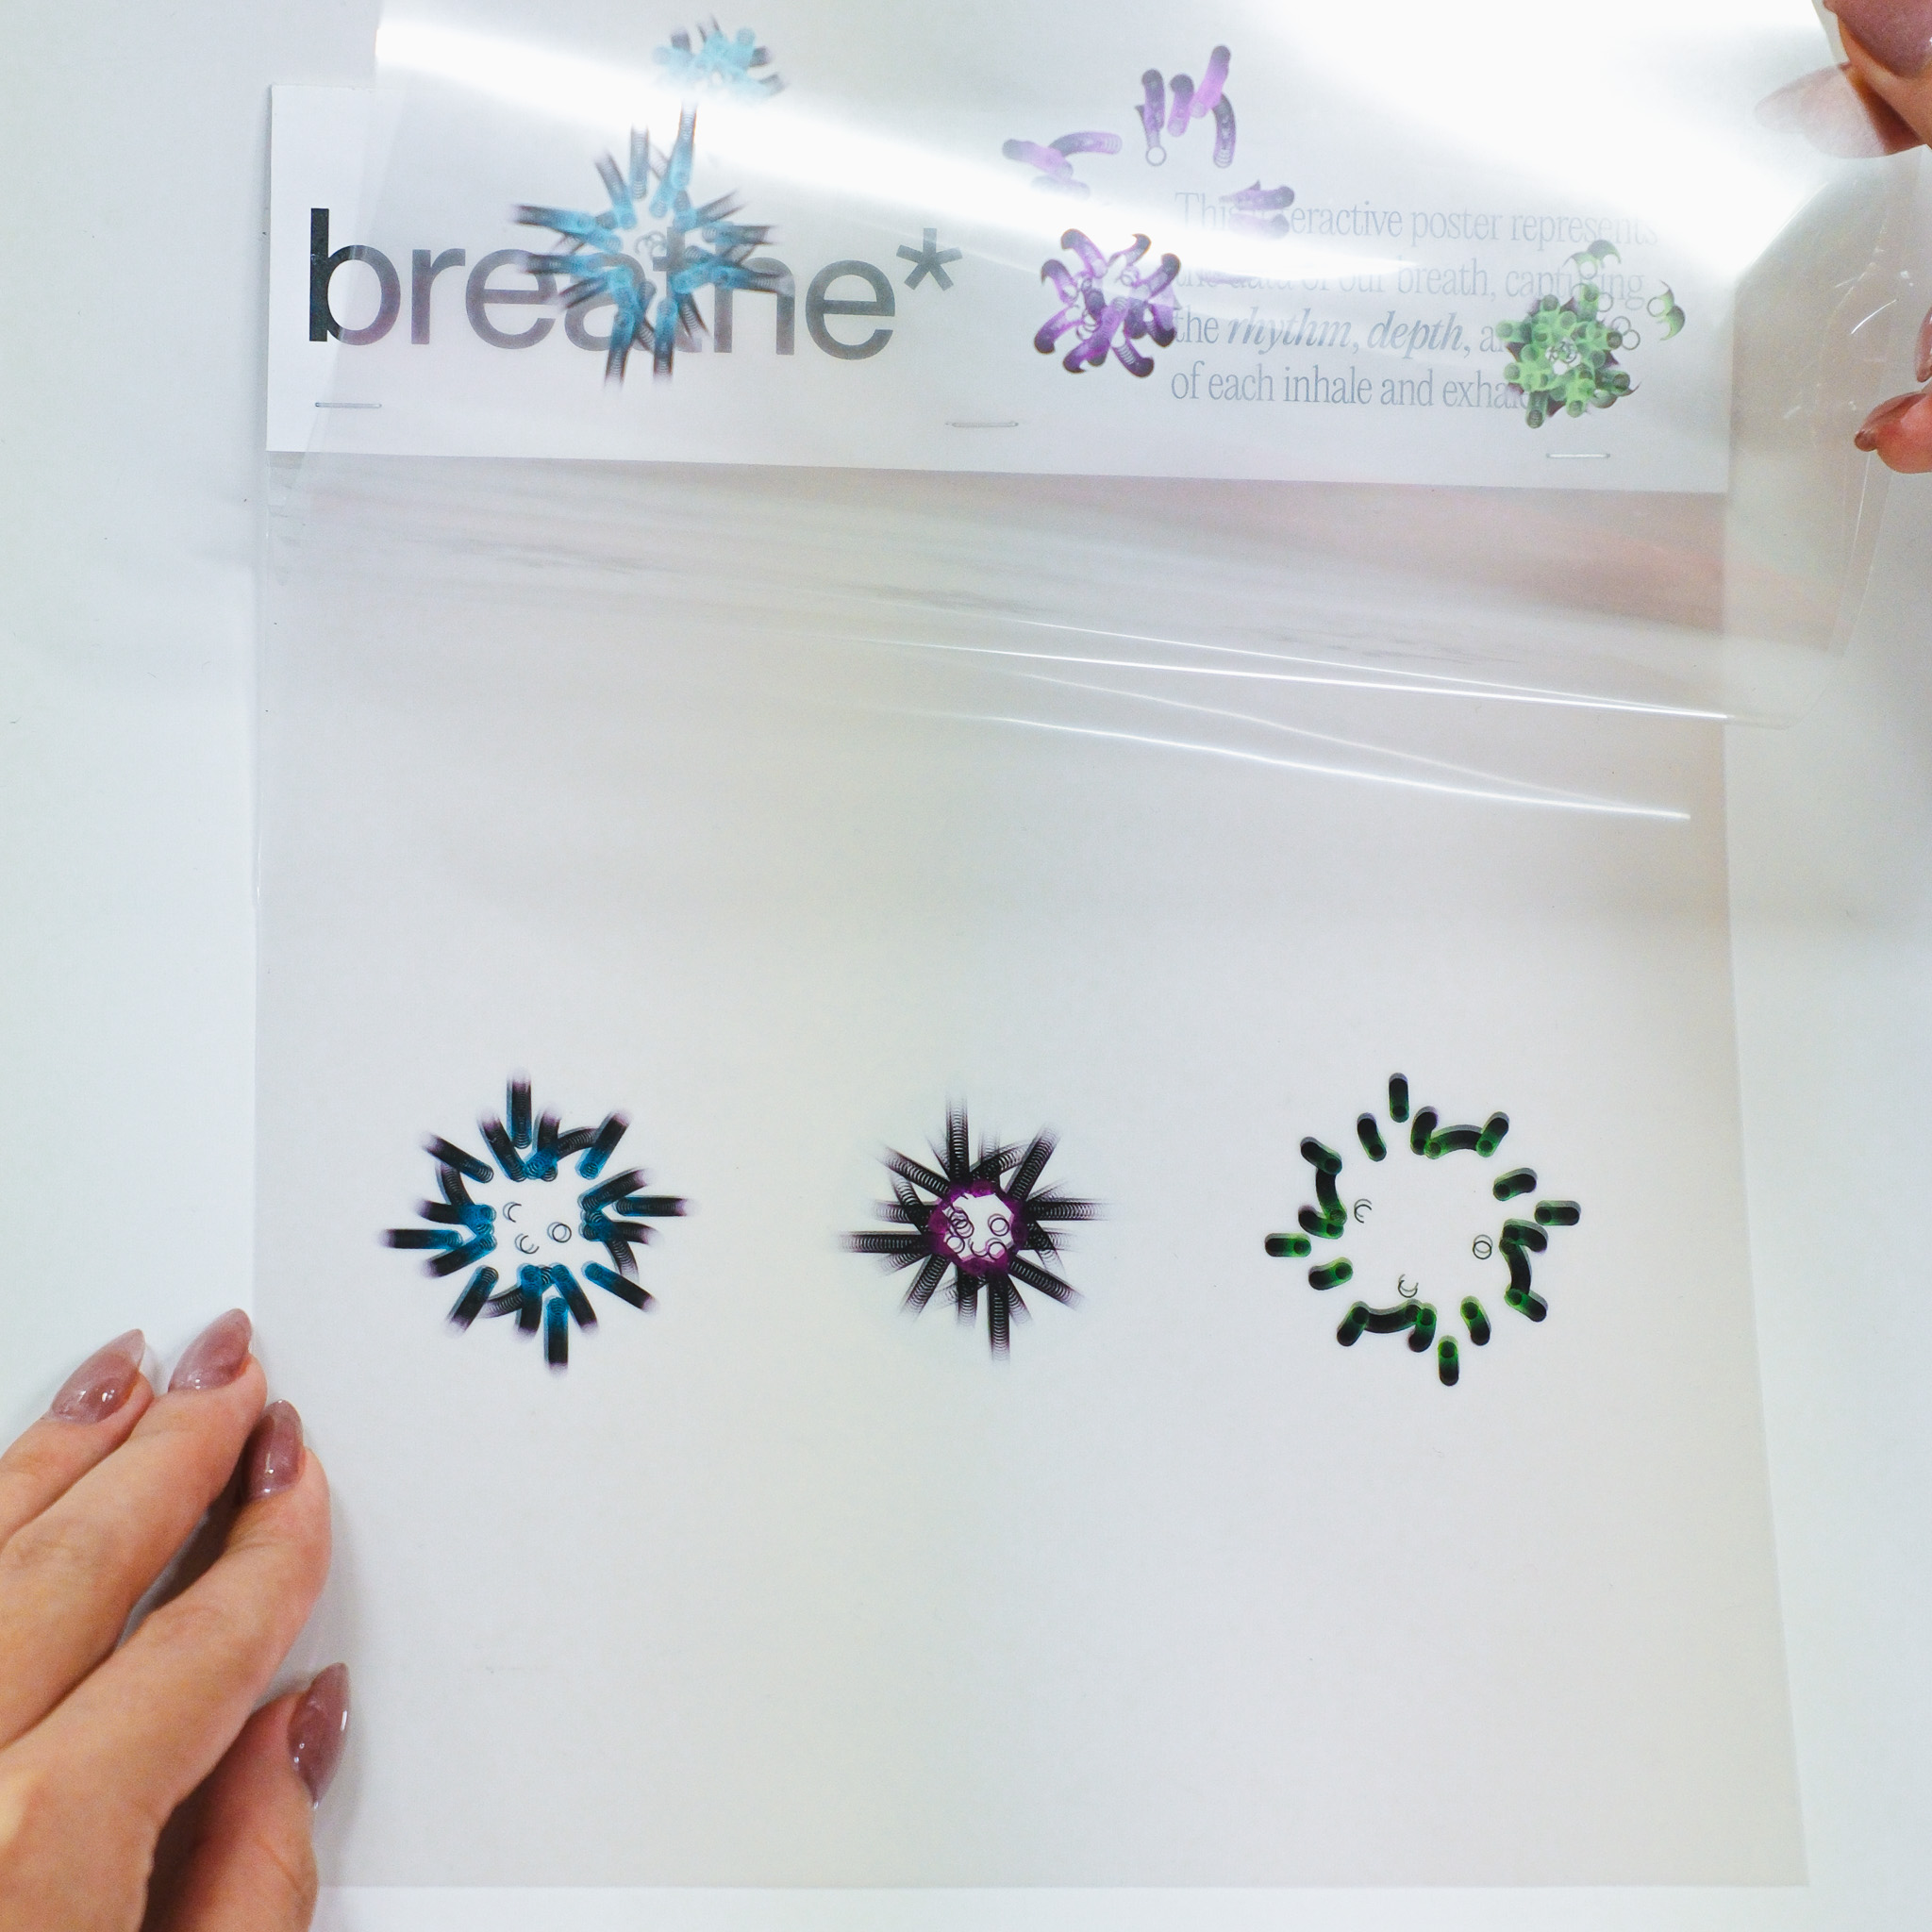
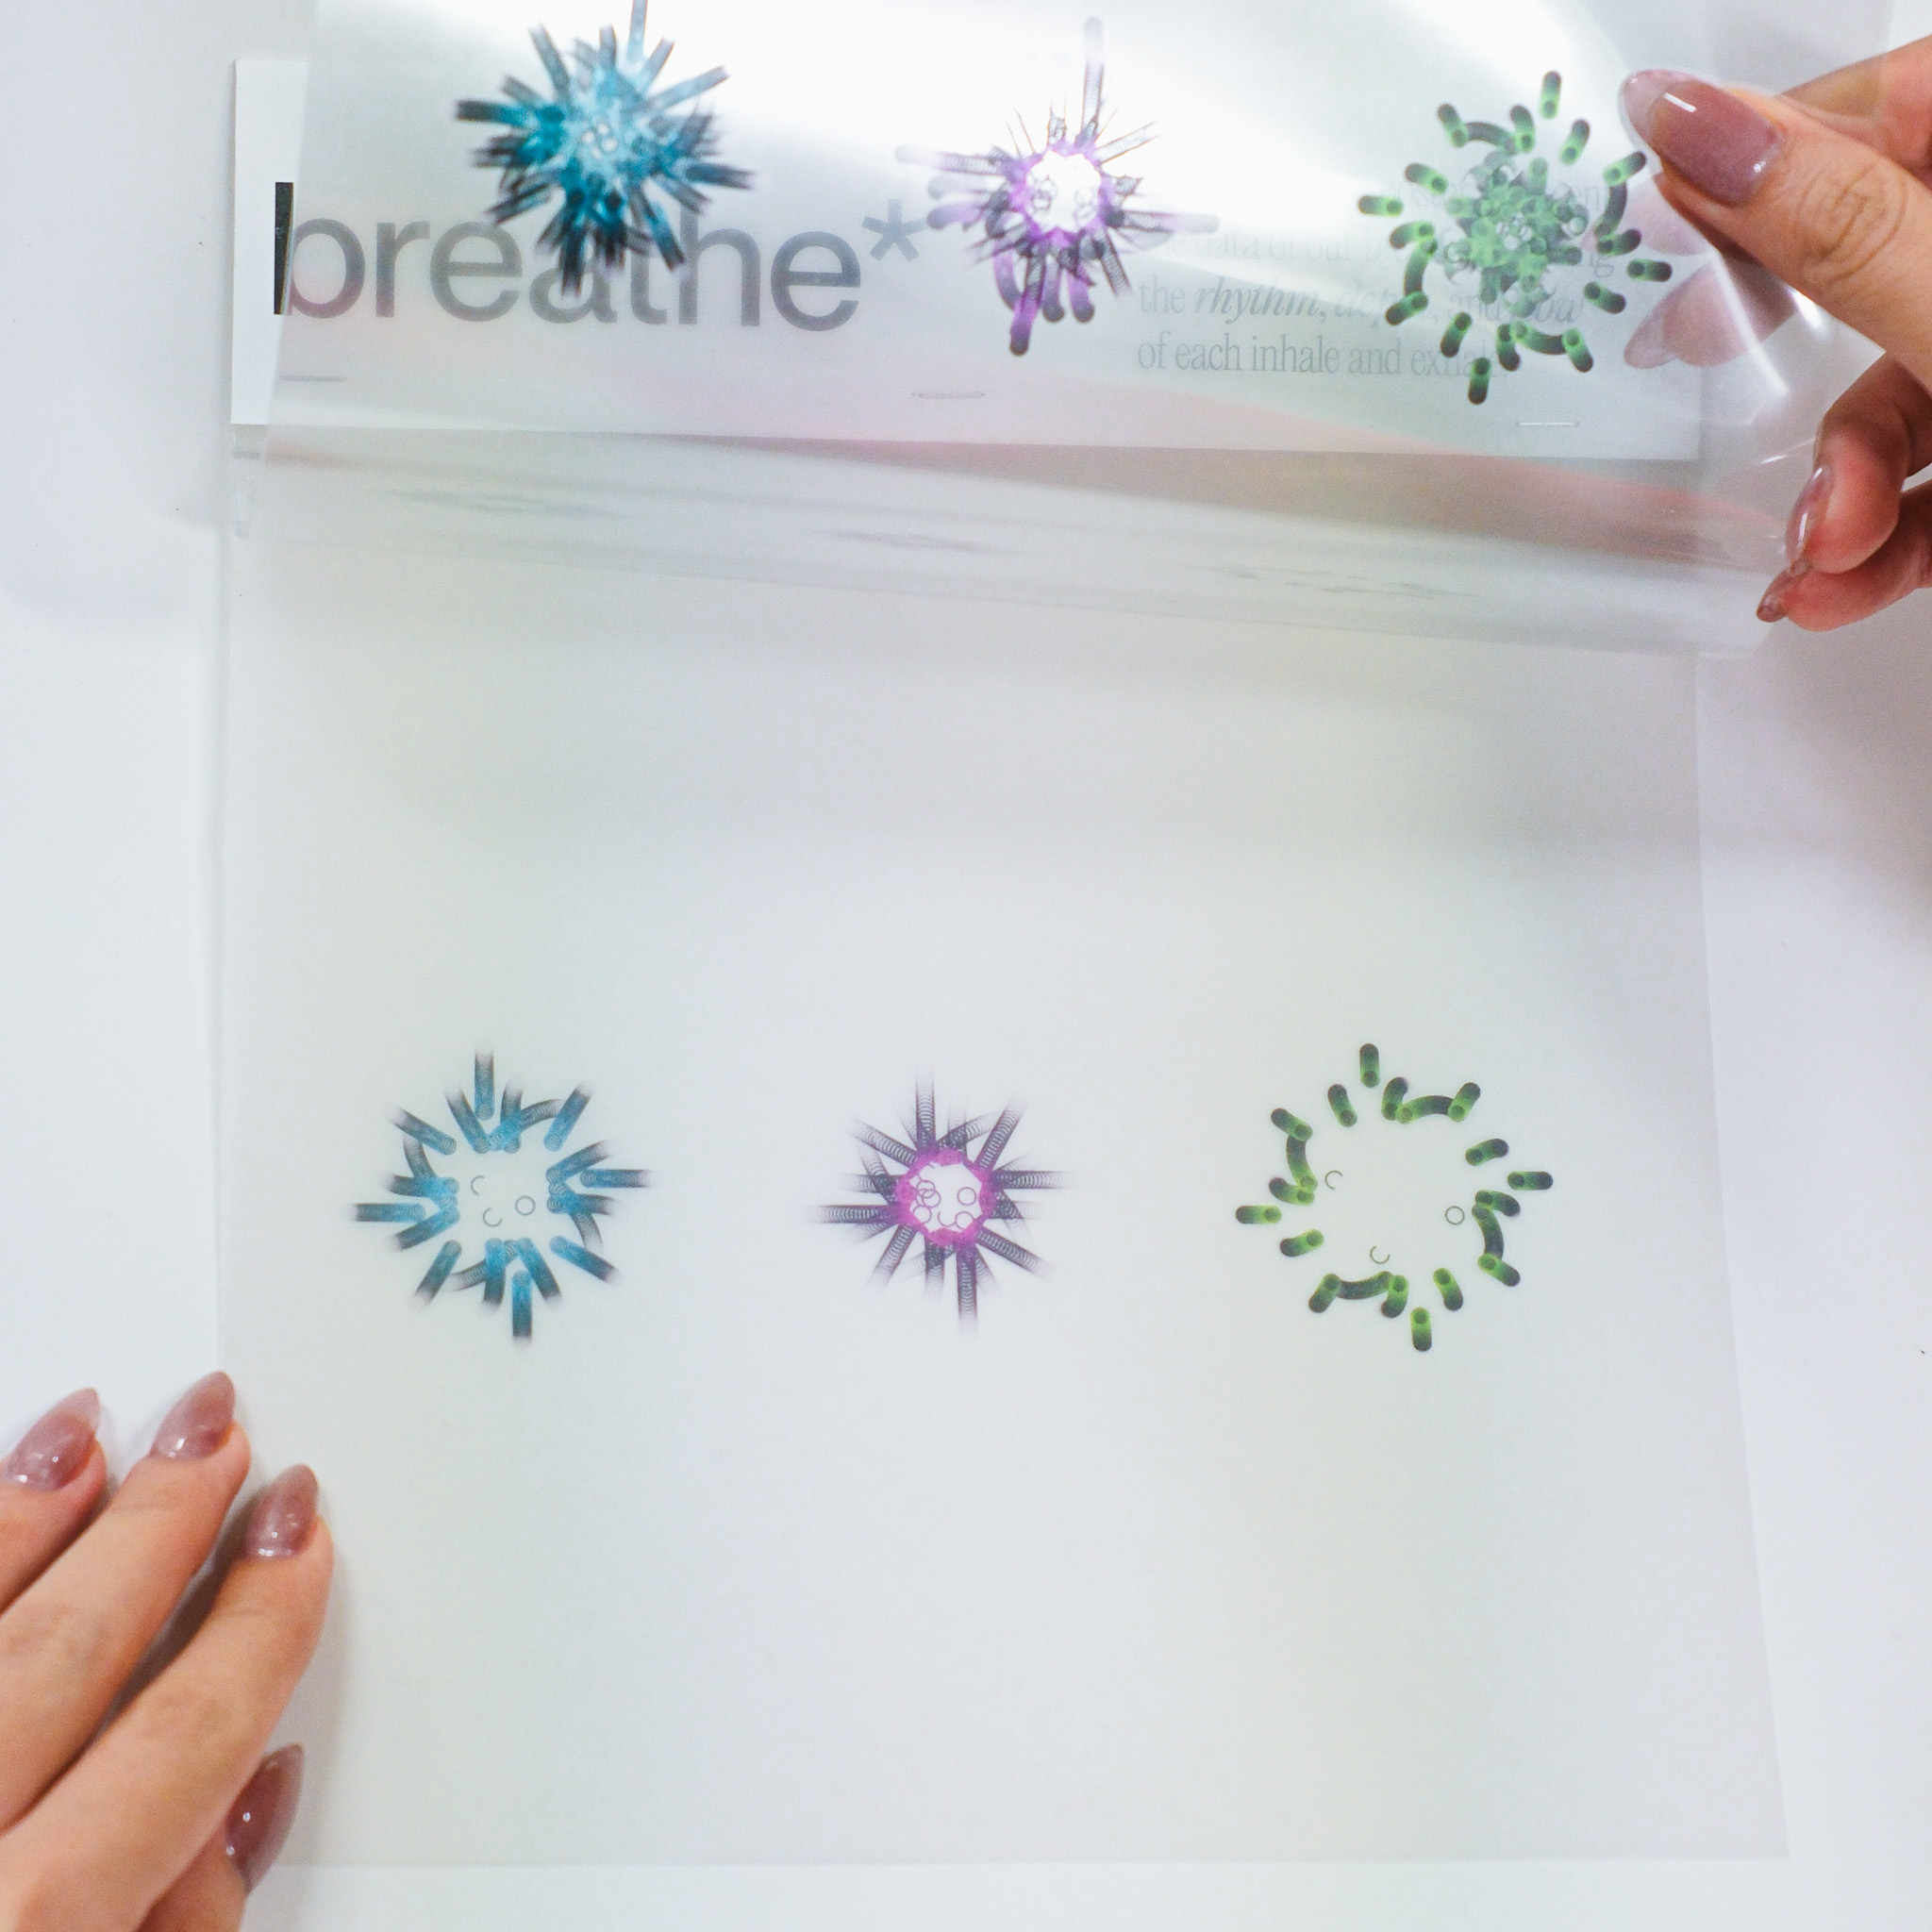
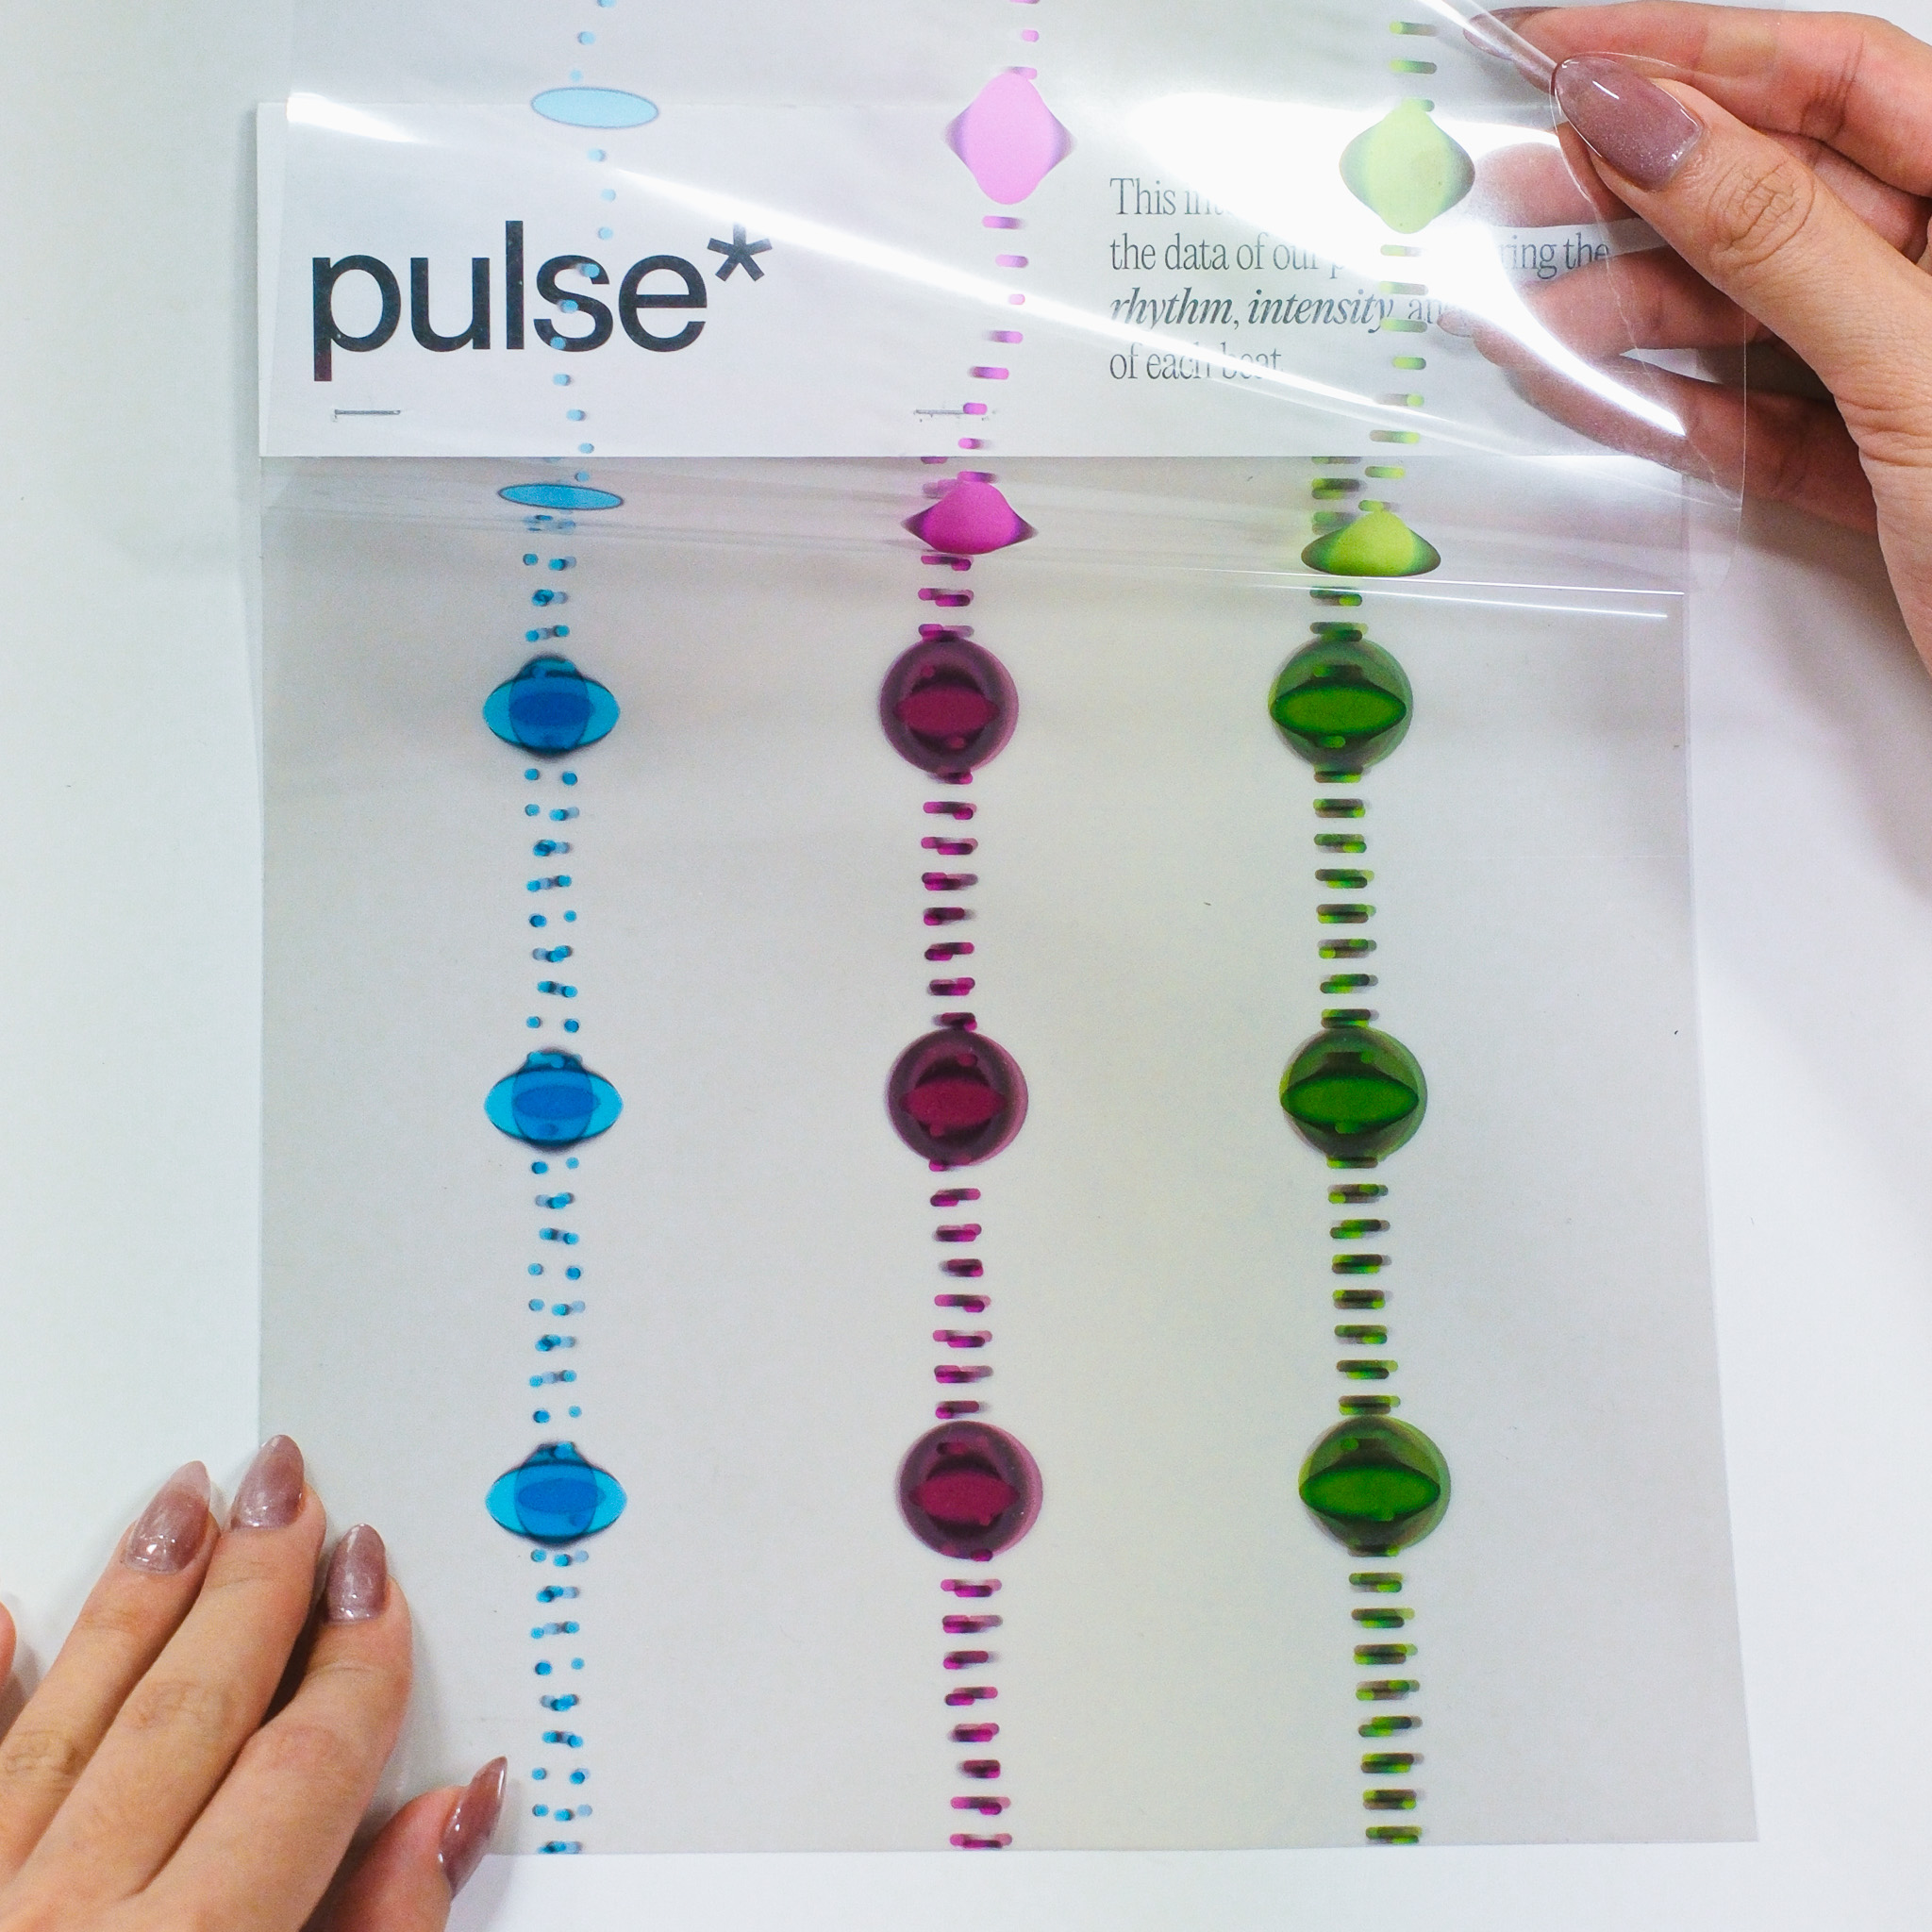
Matching the pages
-
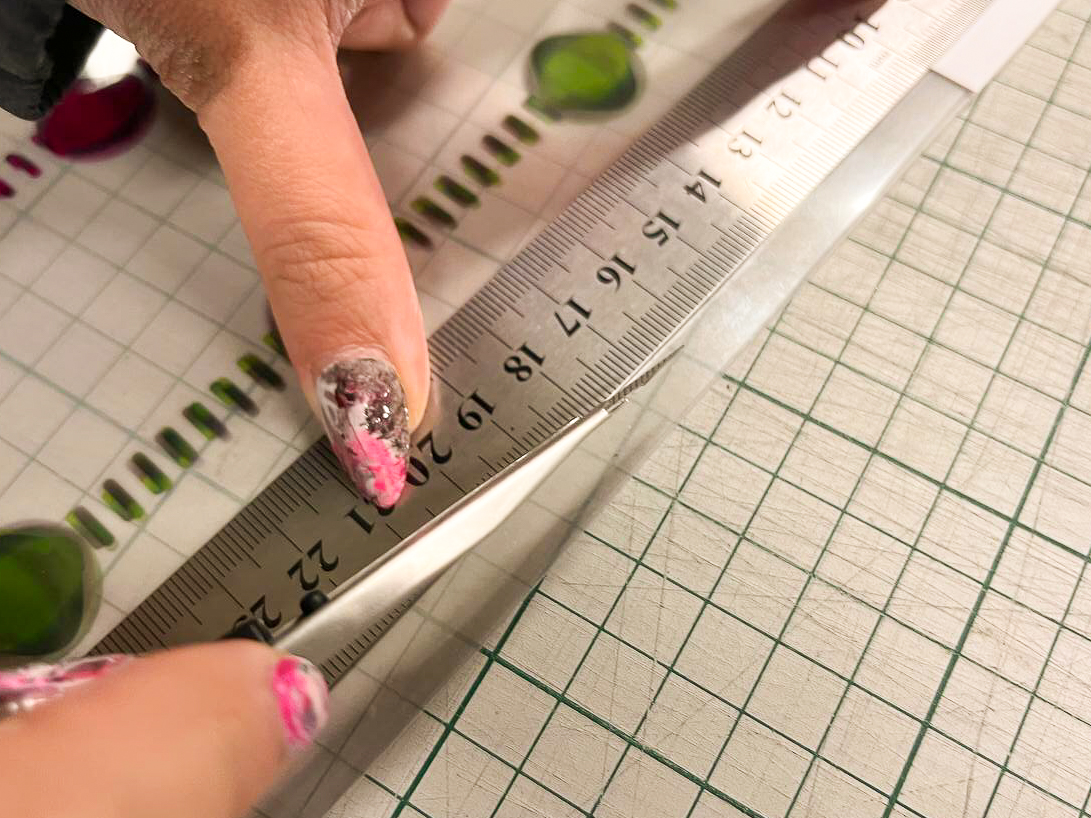
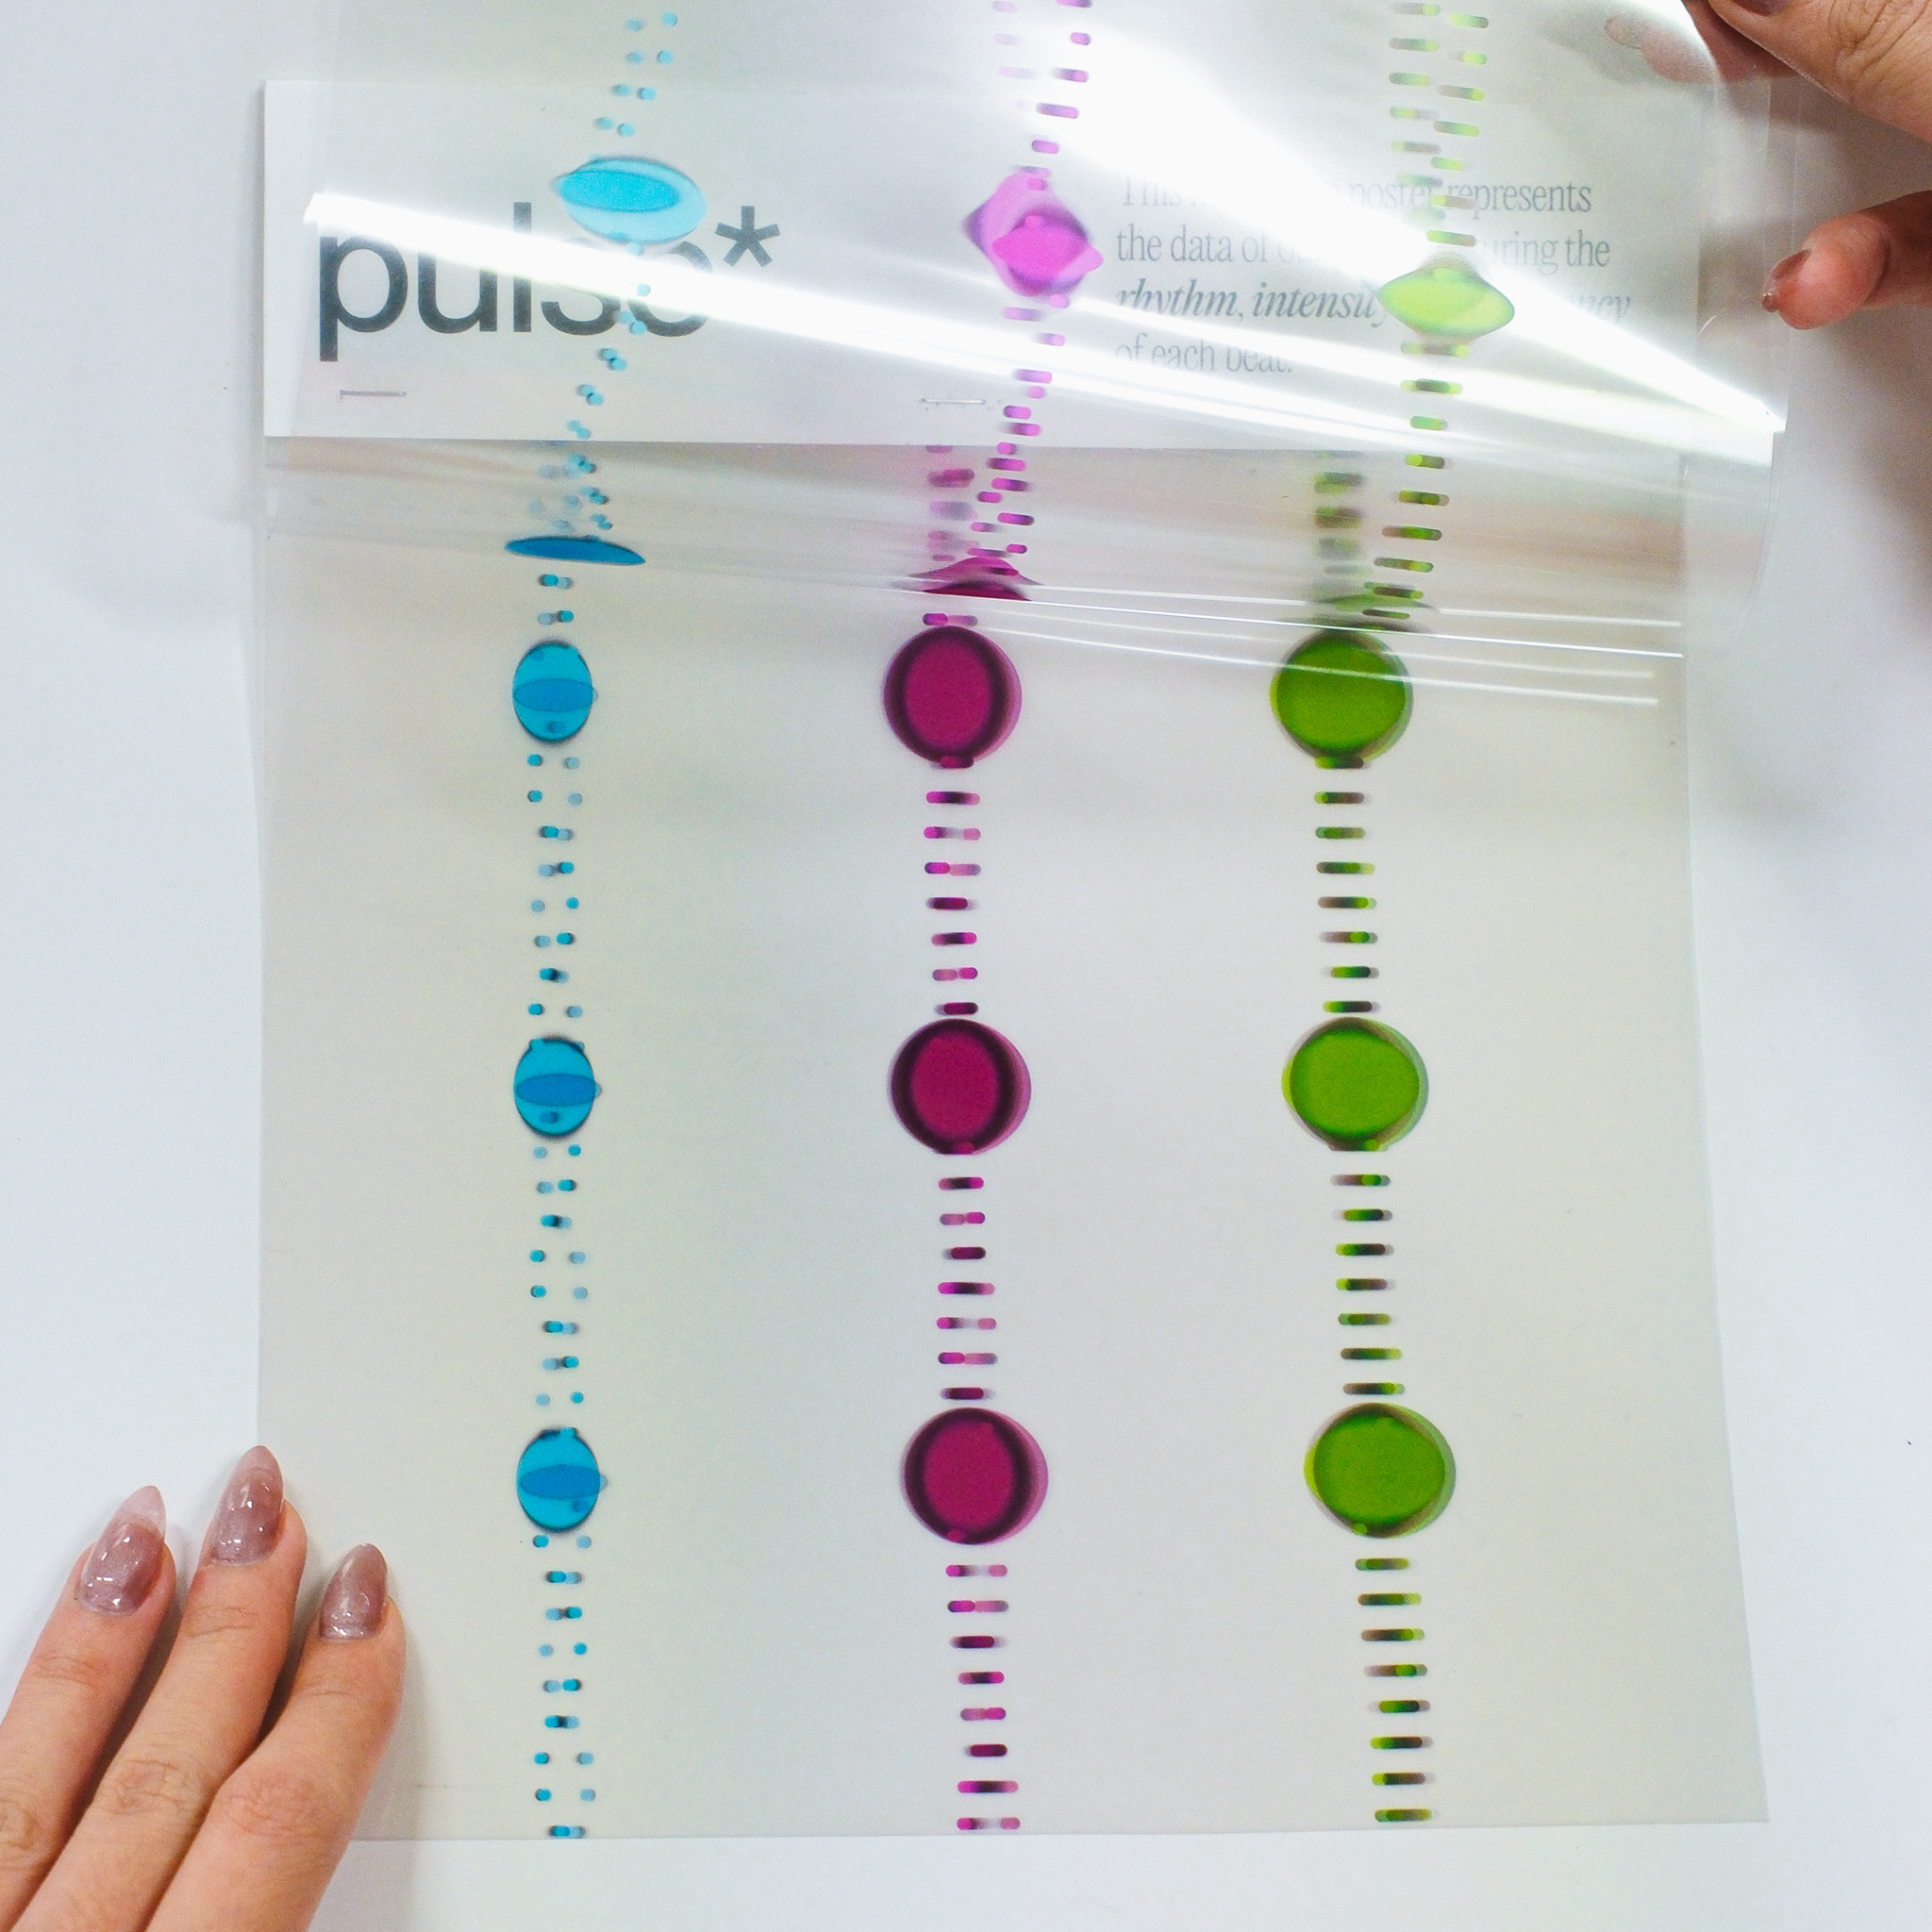
Cutting the sheets


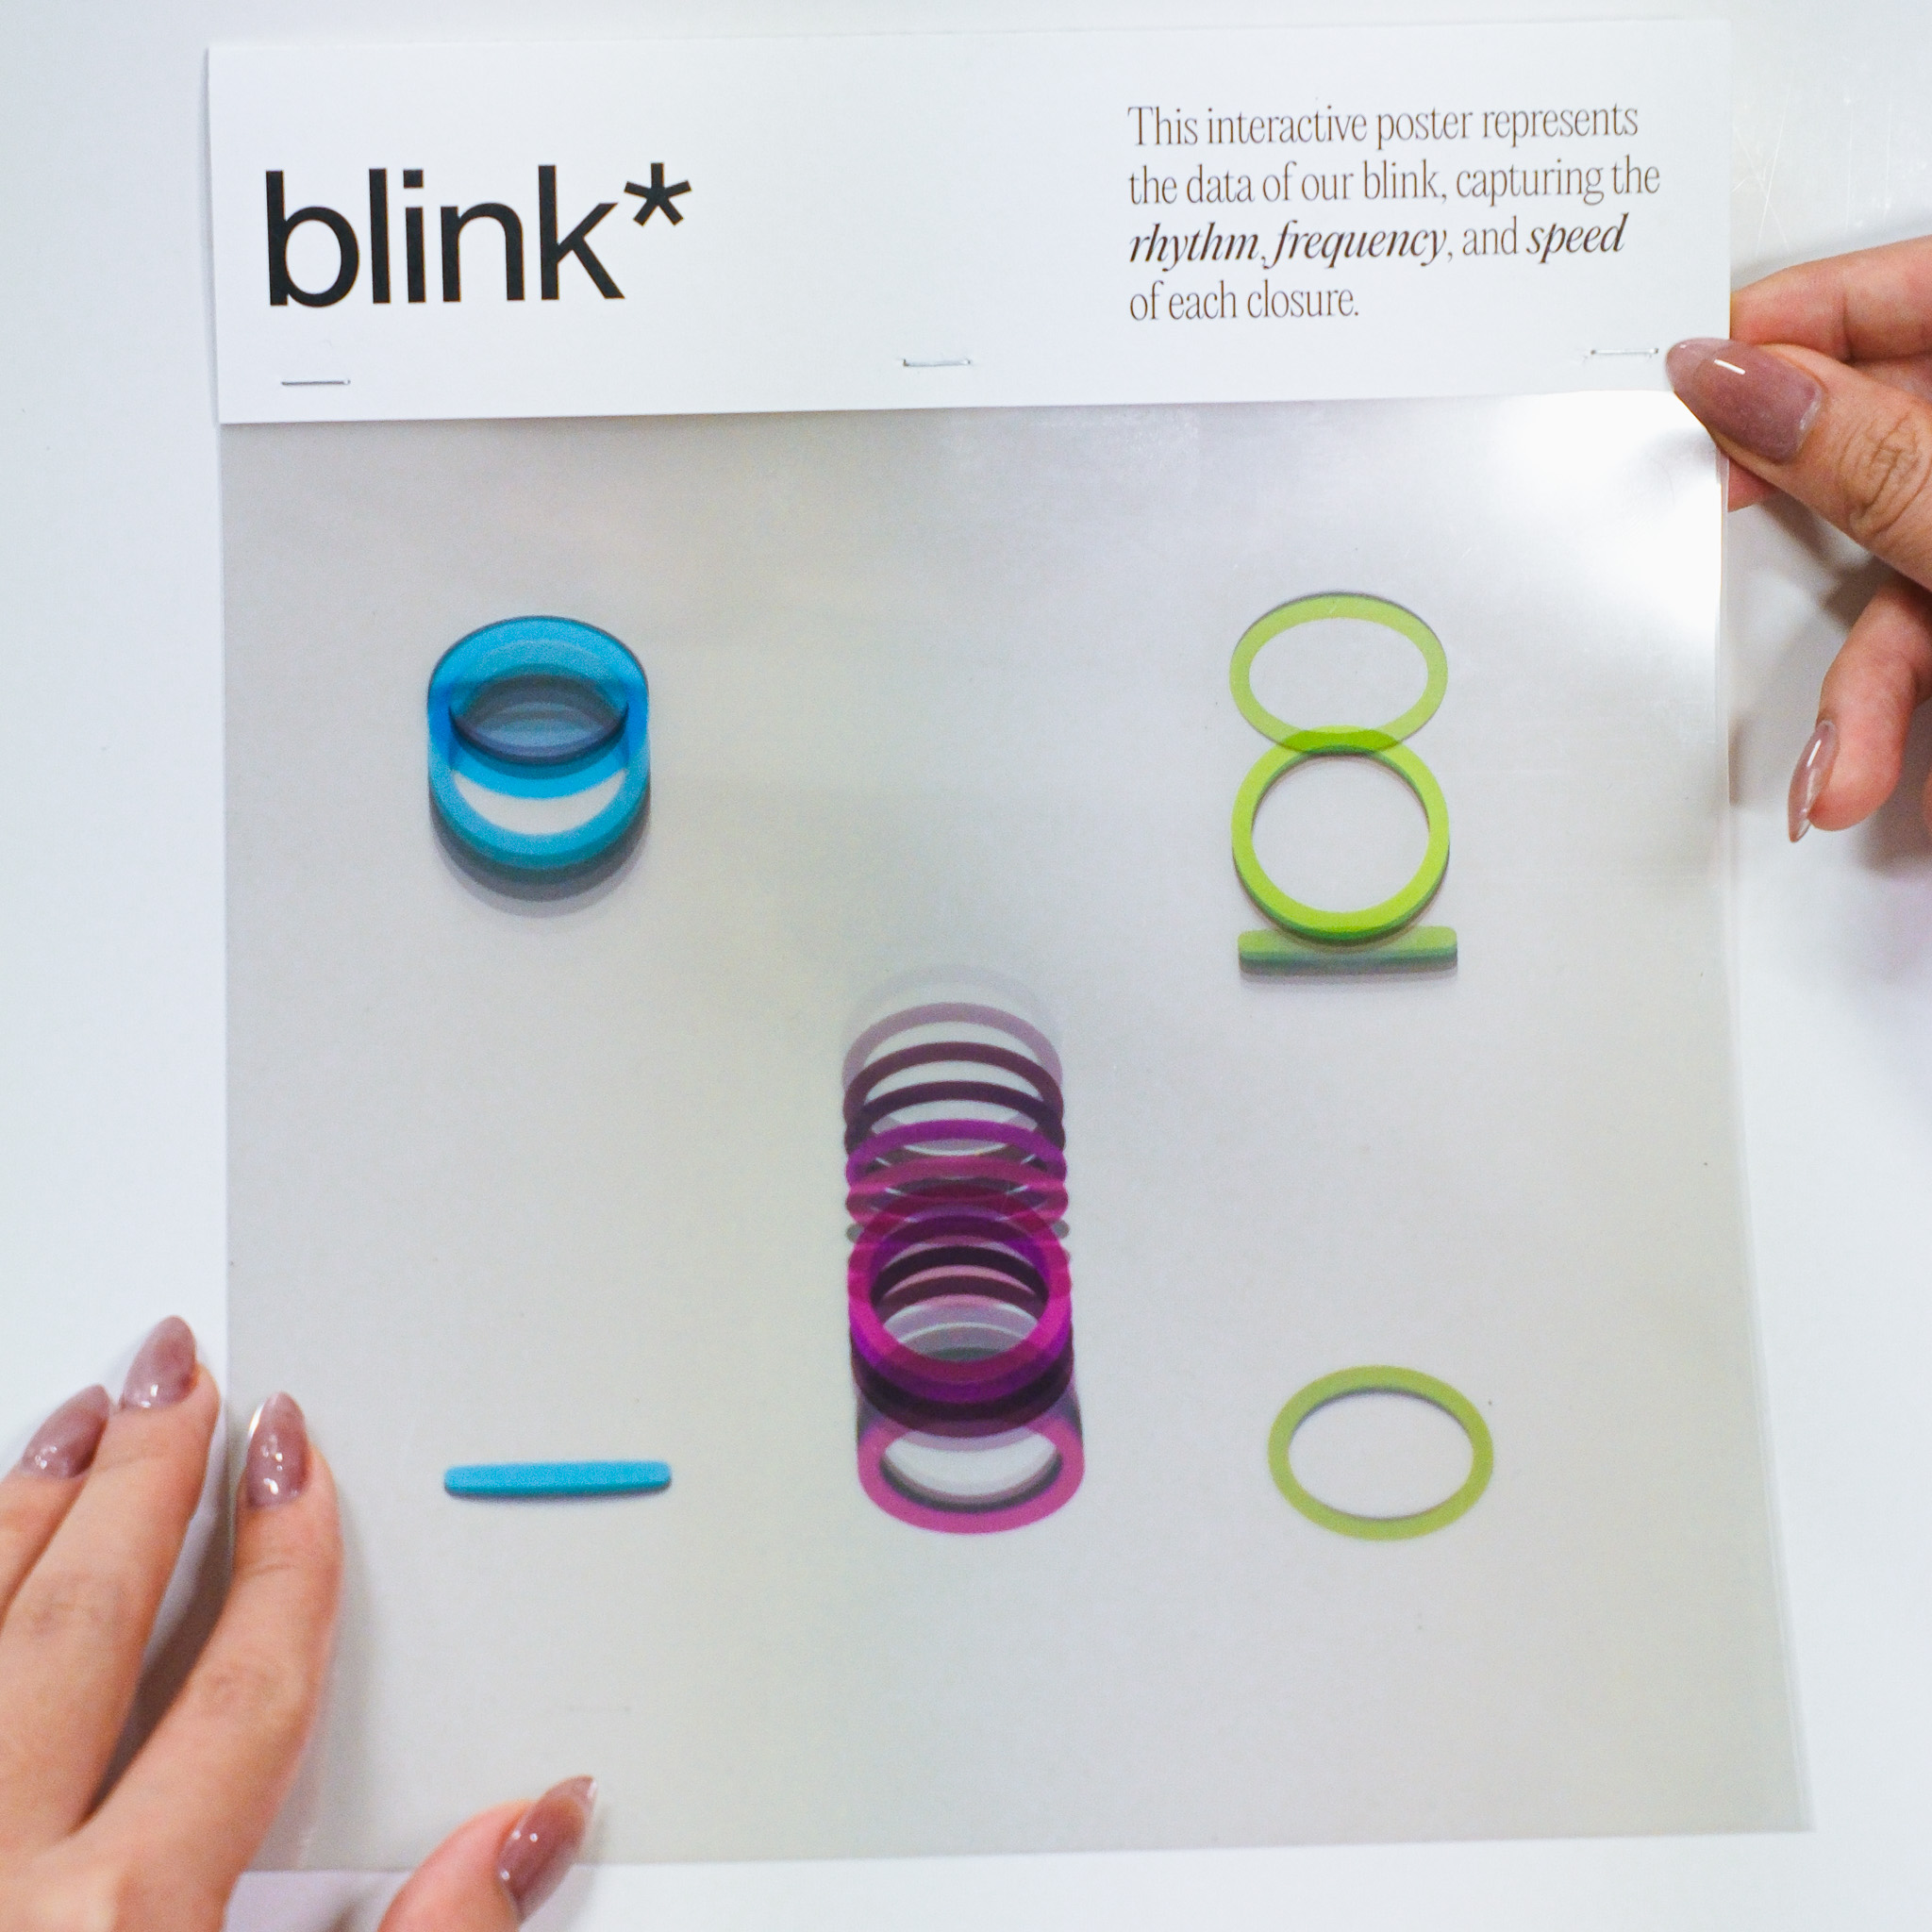
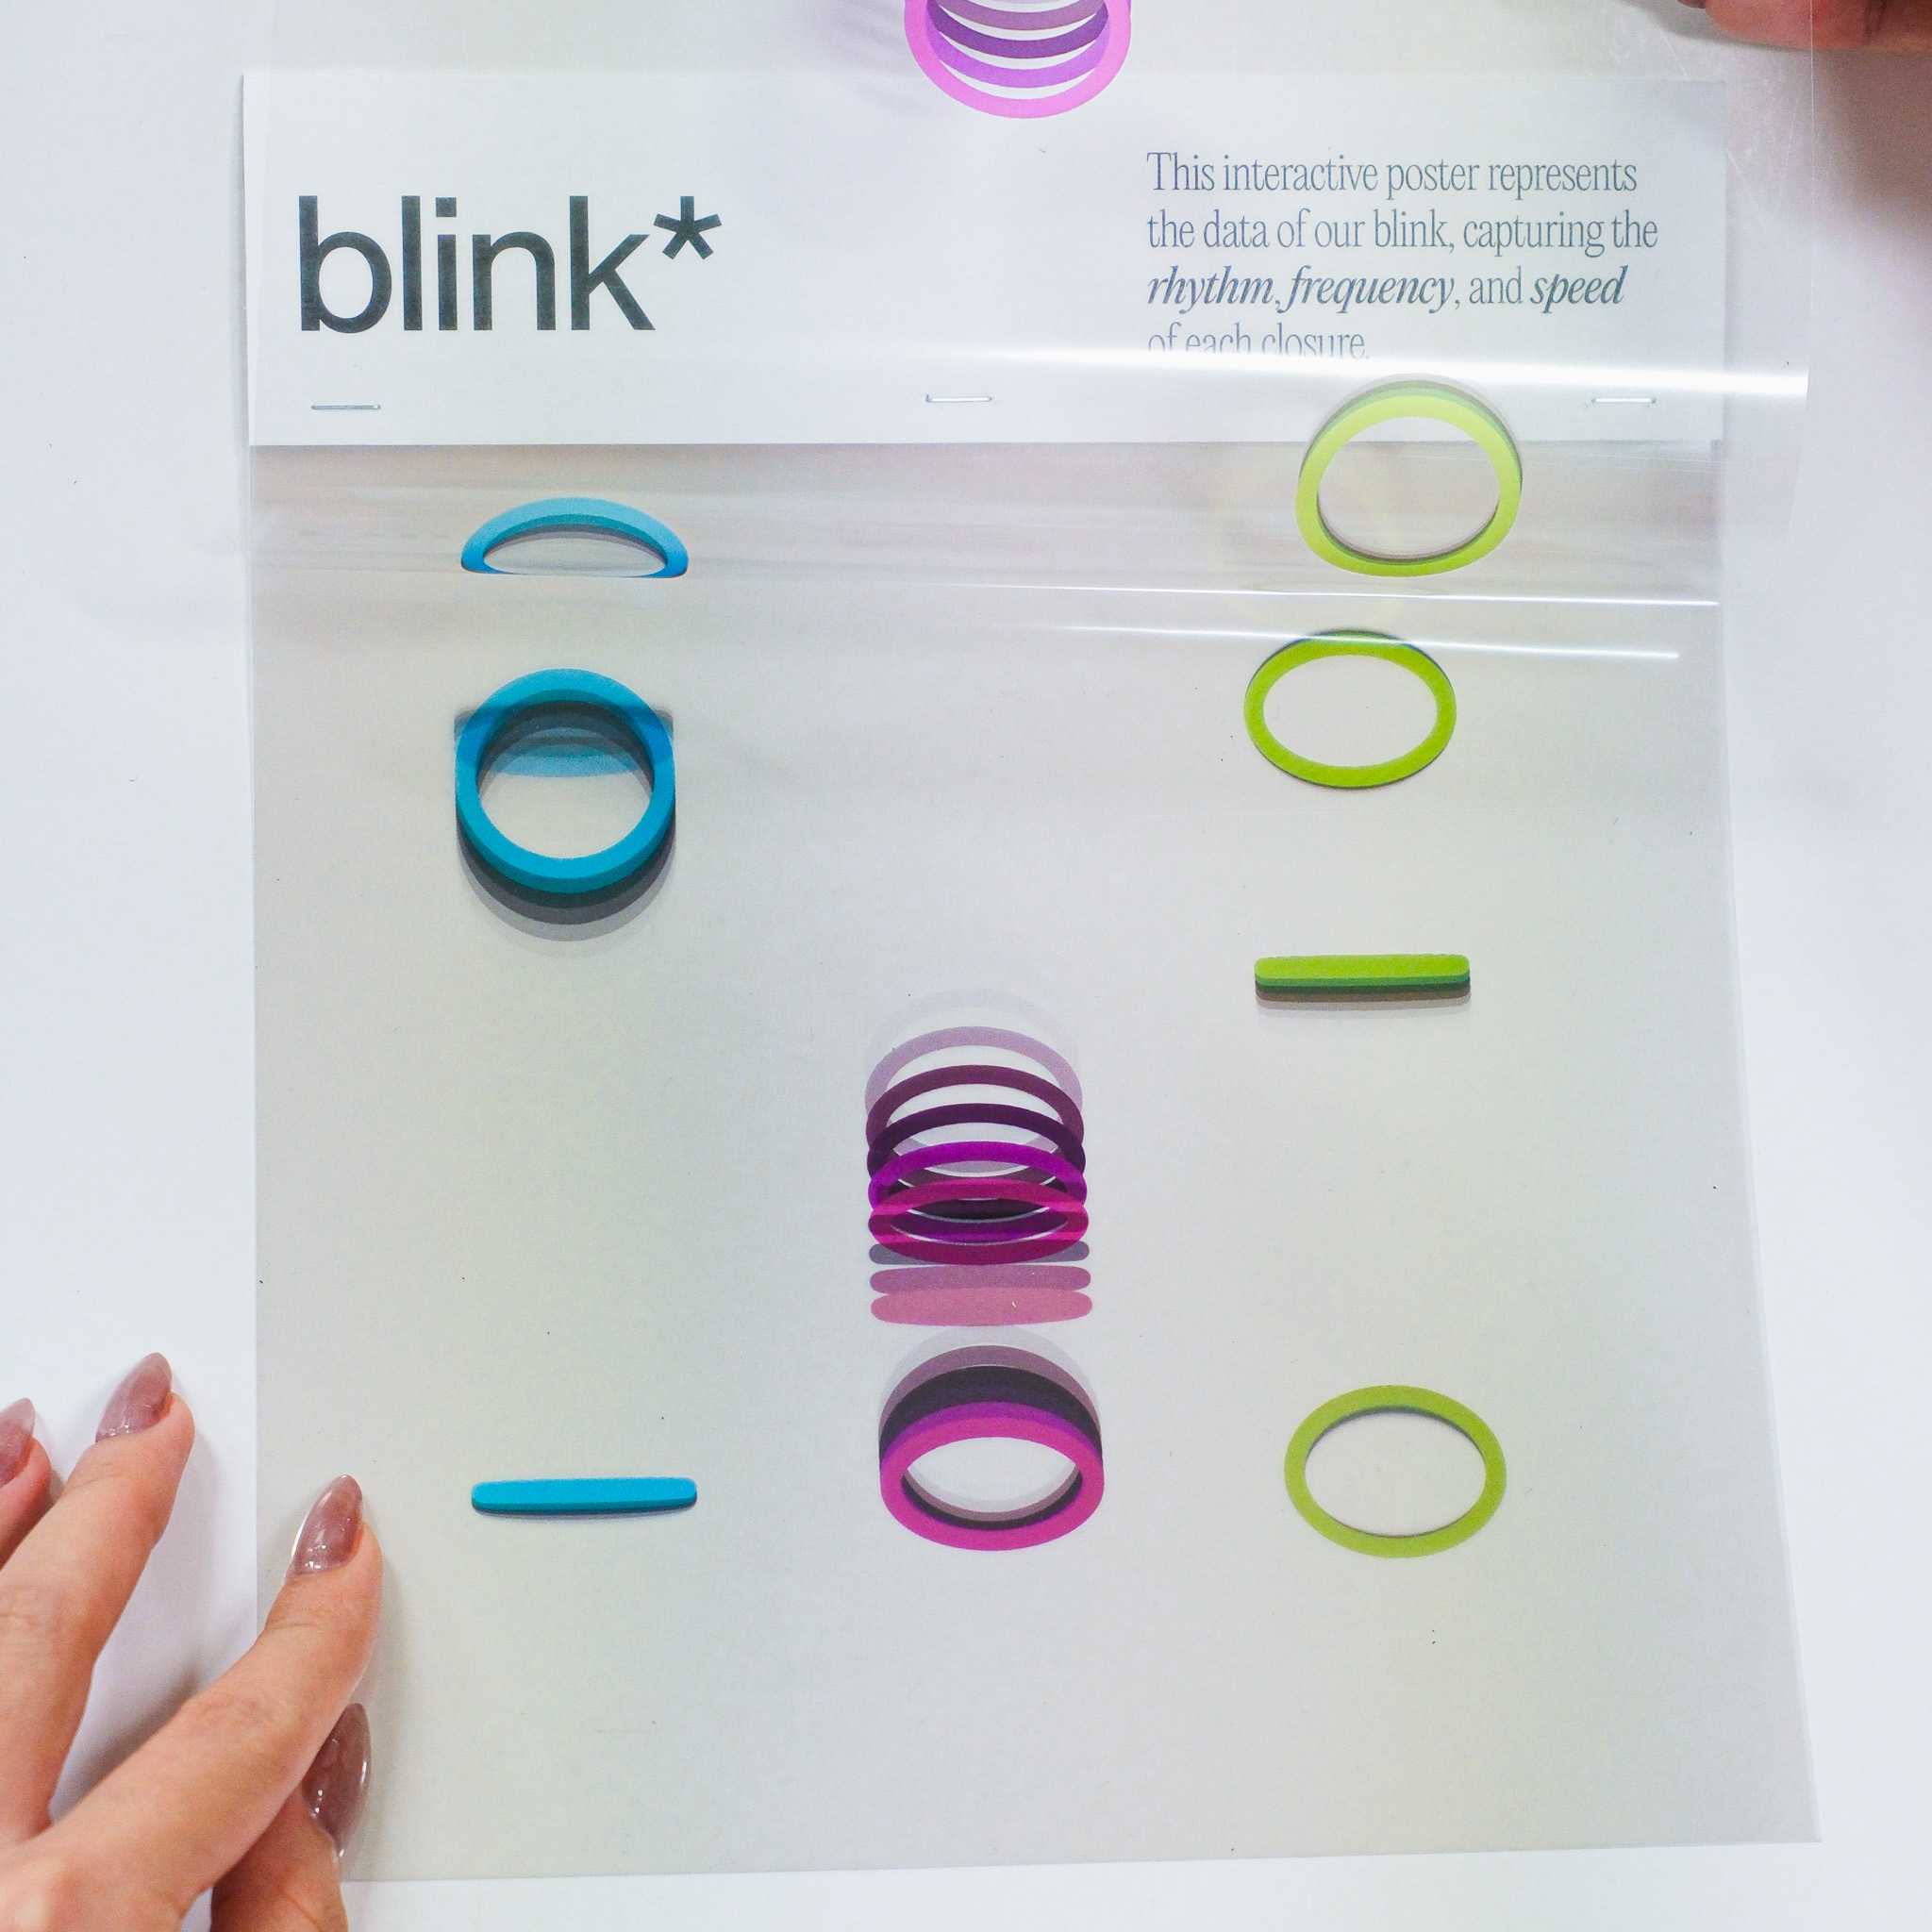
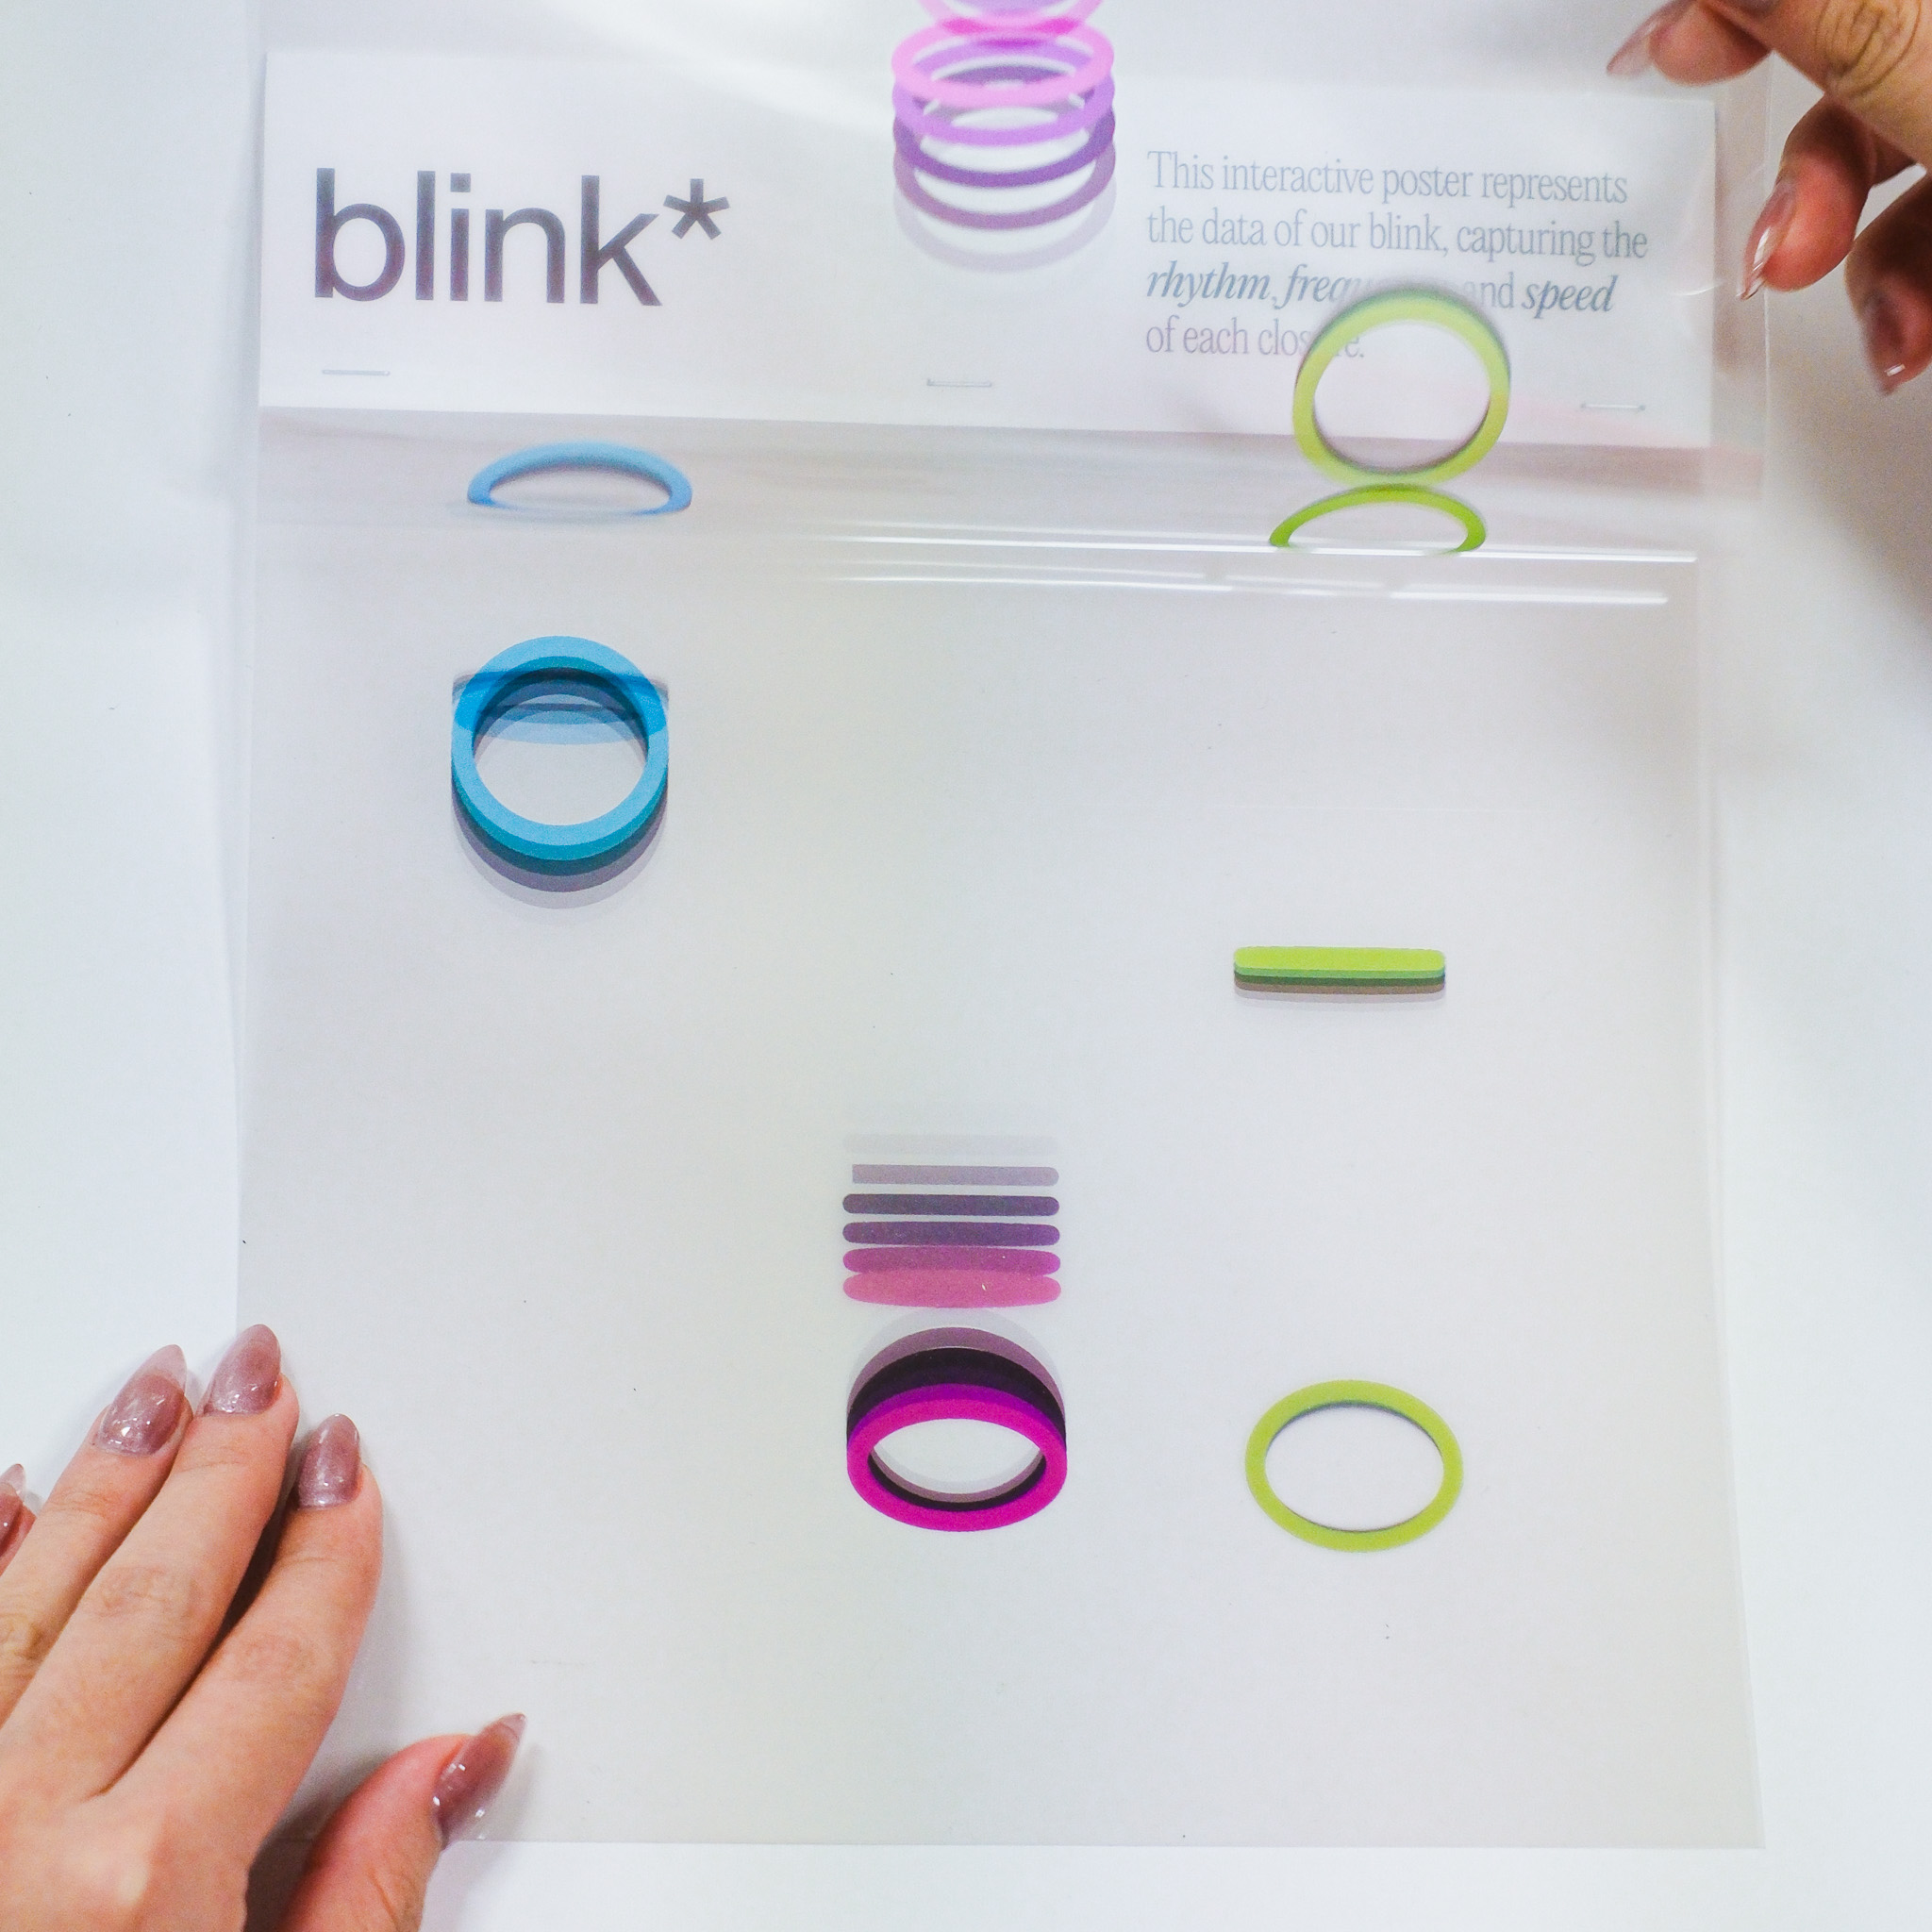
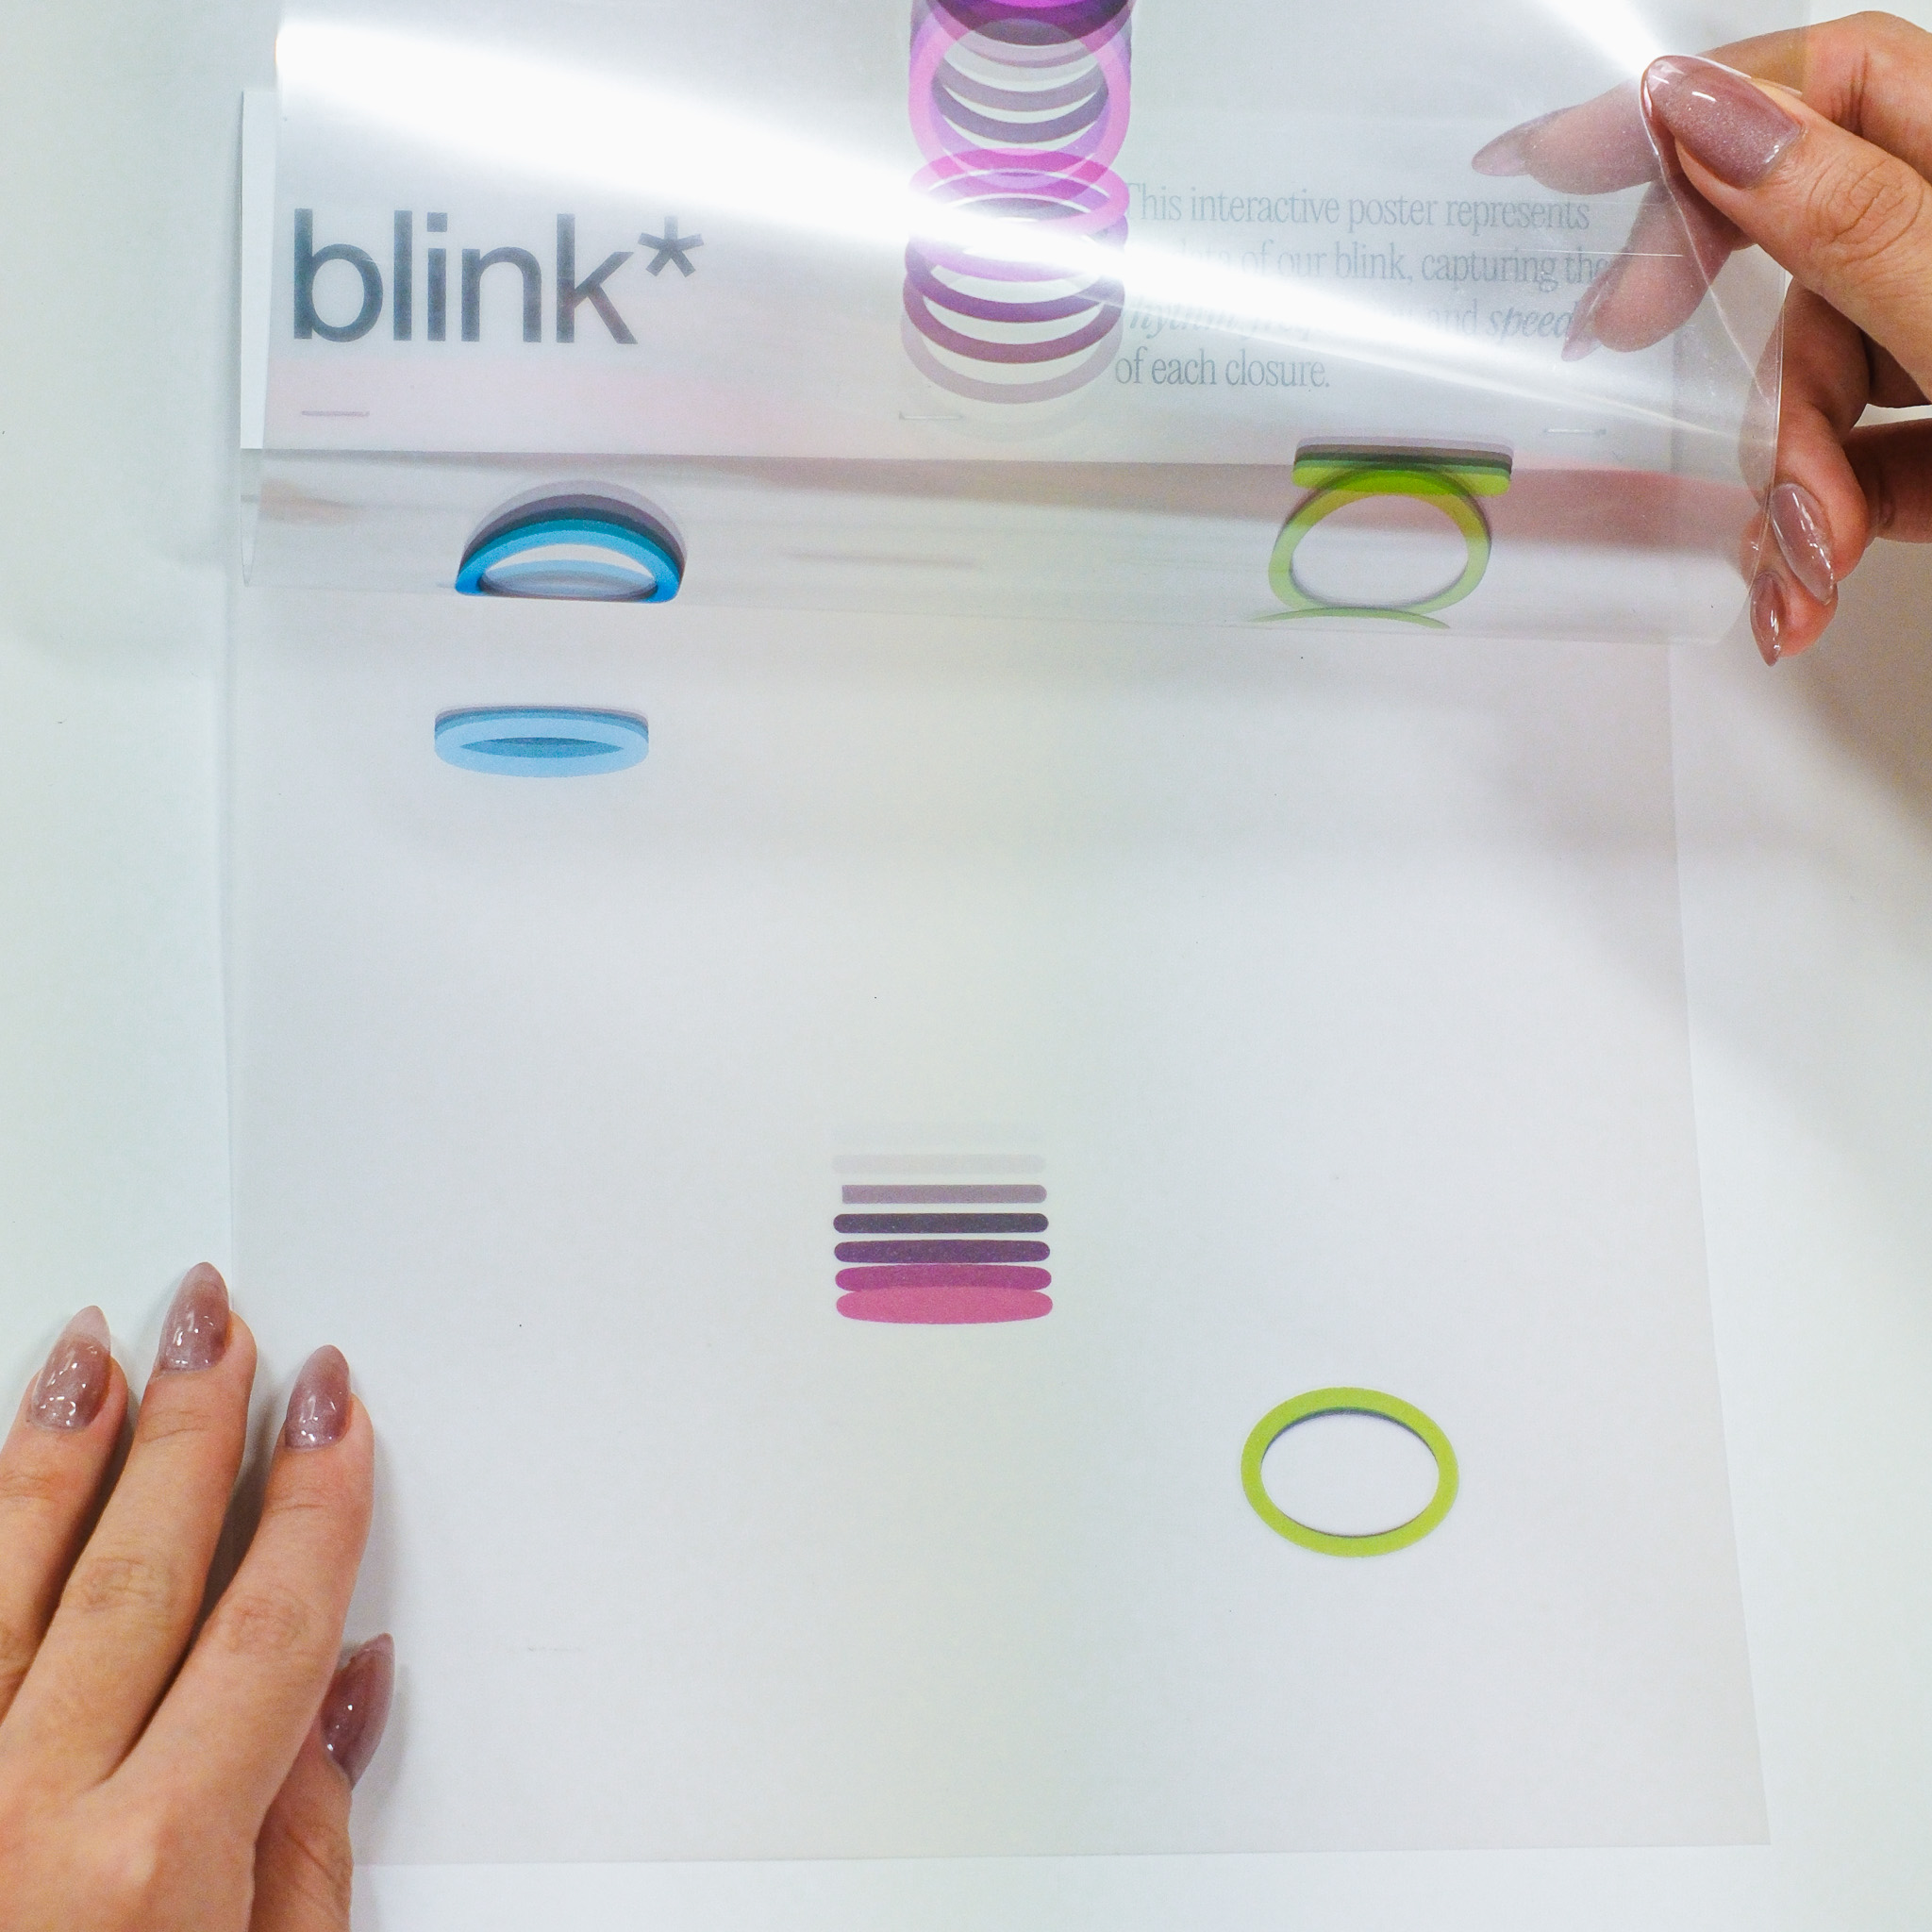

The main challenge faced during the process was aligning the visuals with their intended representation. For example in blink, we had initial difficulties adjusting the movements of the ellipse to create a blinking effect. Thus, it took extra attention to the parameters of the shape to understand what to transform to achieve the desired results.